OPEN-SOURCE SCRIPT
Mis à jour Horizontal Price Table
Overview:
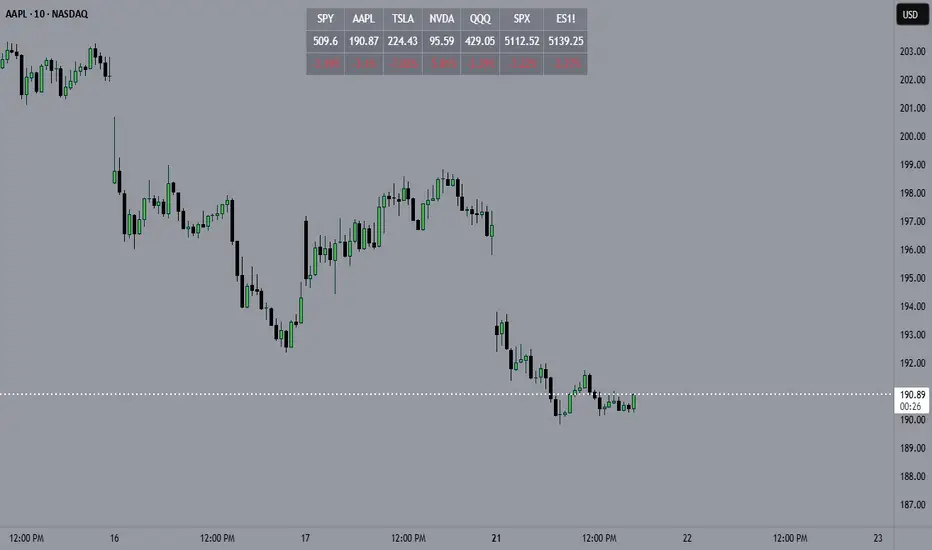
This script displays a dynamic price table on your chart, showing real-time prices and daily percentage changes for up to 7 user-defined tickers. You can customize both which tickers are shown and how many are visible, all through the settings panel.
How it works (Step-by-Step):
User-Defined Tickers:
The script provides input fields for up to 7 tickers using input.symbol(). You can track stocks, indexes, ETFs, crypto, or futures — anything supported by TradingView.
Choose How Many to Display:
An additional dropdown lets you choose how many of the 7 tickers to actually display (between 1 and 7). This gives you control over screen space and focus.
Market Data Fetching:
For each displayed ticker, the script fetches:
The current day’s closing price (close)
The previous day’s closing price (close[1])
This data is pulled using request.security() on the daily timeframe (1D).
% Change Calculation:
The script calculates the daily percentage change using:
(Current Price−Previous Close)/Previous Close×100(Current Price−Previous Close)/Previous Close×100
Cleaned Ticker Names:
Ticker symbols often include an exchange prefix like NASDAQ:AAPL. The script automatically removes anything before the colon (:), so only the clean symbol (e.g., AAPL) is shown in the table.
Table Display:
A visual table appears at the top-center of your chart, showing:
Customization:
Why Use This Script?
Tips:
This script displays a dynamic price table on your chart, showing real-time prices and daily percentage changes for up to 7 user-defined tickers. You can customize both which tickers are shown and how many are visible, all through the settings panel.
How it works (Step-by-Step):
User-Defined Tickers:
The script provides input fields for up to 7 tickers using input.symbol(). You can track stocks, indexes, ETFs, crypto, or futures — anything supported by TradingView.
Choose How Many to Display:
An additional dropdown lets you choose how many of the 7 tickers to actually display (between 1 and 7). This gives you control over screen space and focus.
Market Data Fetching:
For each displayed ticker, the script fetches:
The current day’s closing price (close)
The previous day’s closing price (close[1])
This data is pulled using request.security() on the daily timeframe (1D).
% Change Calculation:
The script calculates the daily percentage change using:
(Current Price−Previous Close)/Previous Close×100(Current Price−Previous Close)/Previous Close×100
Cleaned Ticker Names:
Ticker symbols often include an exchange prefix like NASDAQ:AAPL. The script automatically removes anything before the colon (:), so only the clean symbol (e.g., AAPL) is shown in the table.
Table Display:
A visual table appears at the top-center of your chart, showing:
- Row 1: Ticker symbol (cleaned)
- Row 2: Current price (rounded to 2 decimals)
- Row 3: Daily % change (green for gains, red for losses)
Customization:
- You can choose the background color of the table.
- Ticker names appear in white text with a gray background.
- % change is color-coded: green for positive, red for negative.
Why Use This Script?
- Track multiple tickers at once without leaving your chart.
- Clean, customizable layout.
- Useful for monitoring watchlists, portfolios, or related markets.
Tips:
- Combine this with your favorite indicators for a personalized dashboard.
- Works great on any chart or timeframe.
- Ensure the tickers entered are valid on TradingView (e.g., SPY, BTCUSD, NQ1!, etc.).
Notes de version
Overview:This script displays a dynamic price table on your chart, showing real-time prices and daily percentage changes for up to 7 user-defined tickers. You can customize both which tickers are shown and how many are visible, all through the settings panel.
How it works (Step-by-Step):
User-Defined Tickers:
The script provides input fields for up to 7 tickers using input.symbol(). You can track stocks, indexes, ETFs, crypto, or futures — anything supported by TradingView.
Choose How Many to Display:
An additional dropdown lets you choose how many of the 7 tickers to actually display (between 1 and 7). This gives you control over screen space and focus.
Market Data Fetching:
For each displayed ticker, the script fetches:
The current day’s closing price (close)
The previous day’s closing price (close[1])
This data is pulled using request.security() on the daily timeframe (1D).
% Change Calculation:
The script calculates the daily percentage change using:
(Current Price−Previous Close)/Previous Close×100(Current Price−Previous Close)/Previous Close×100
Cleaned Ticker Names:
Ticker symbols often include an exchange prefix like NASDAQ:AAPL. The script automatically removes anything before the colon (:), so only the clean symbol (e.g., AAPL) is shown in the table.
Table Display:
A visual table appears at the top-center of your chart, showing:
- Row 1: Ticker symbol (cleaned)
- Row 2: Current price (rounded to 2 decimals)
- Row 3: Daily % change (green for gains, red for losses)
Customization:
- You can choose the background color of the table.
- Ticker names appear in white text with a gray background.
% change is color-coded: green for positive, red for negative.
Why Use This Script?
- Track multiple tickers at once without leaving your chart.
- Clean, customizable layout.
- Useful for monitoring watchlists, portfolios, or related markets.
Tips:
- Combine this with your favorite indicators for a personalized dashboard.
- Works great on any chart or timeframe.
- Ensure the tickers entered are valid on TradingView (e.g., SPY, BTCUSD, NQ1!, etc.).
Script open-source
Dans l'esprit TradingView, le créateur de ce script l'a rendu open source afin que les traders puissent examiner et vérifier ses fonctionnalités. Bravo à l'auteur! Bien que vous puissiez l'utiliser gratuitement, n'oubliez pas que la republication du code est soumise à nos Règles.
Clause de non-responsabilité
Les informations et publications ne sont pas destinées à être, et ne constituent pas, des conseils ou recommandations financiers, d'investissement, de trading ou autres fournis ou approuvés par TradingView. Pour en savoir plus, consultez les Conditions d'utilisation.