OPEN-SOURCE SCRIPT
The RSP/VOO indicator
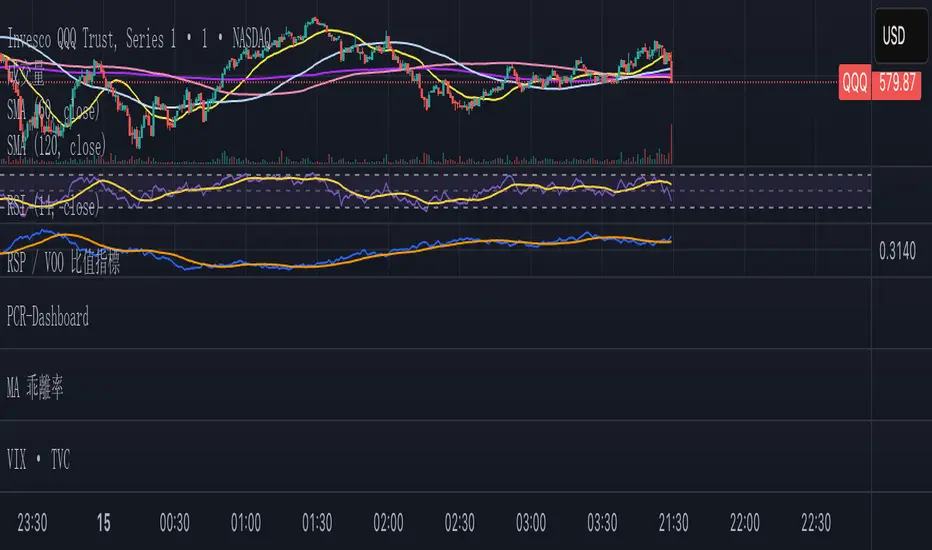
The RSP/VOO indicator refers to the ratio between the performance of two exchange-traded funds (ETFs): RSP (Invesco S&P 500 Equal Weight ETF) and VOO (Vanguard S&P 500 ETF). RSP tracks an equal-weighted version of the S&P 500 index, meaning each of the 500 stocks in the index is given the same weight regardless of company size. In contrast, VOO is a market-cap-weighted ETF, where larger companies (like Apple or Microsoft) have a greater influence on the fund's performance based on their market capitalization.
This ratio (RSP divided by VOO) is often used as a market breadth indicator in finance. When the RSP/VOO ratio rises, it suggests that smaller or mid-sized stocks in the S&P 500 are outperforming the largest ones, indicating broader market participation and potentially healthier overall market conditions. Conversely, when the ratio falls, it implies that a few mega-cap stocks are driving the market's gains, which can signal increased concentration risk or a narrower rally. For example, RSP provides more diversified exposure by reducing concentration in large-cap stocks, while VOO reflects the dominance of top-weighted holdings. Investors might monitor this ratio to gauge market sentiment, with RSP historically showing higher expense ratios (around 0.20%) compared to VOO's lower fees (about 0.03%), but offering potentially better risk-adjusted returns in certain environments.1.6秒
This ratio (RSP divided by VOO) is often used as a market breadth indicator in finance. When the RSP/VOO ratio rises, it suggests that smaller or mid-sized stocks in the S&P 500 are outperforming the largest ones, indicating broader market participation and potentially healthier overall market conditions. Conversely, when the ratio falls, it implies that a few mega-cap stocks are driving the market's gains, which can signal increased concentration risk or a narrower rally. For example, RSP provides more diversified exposure by reducing concentration in large-cap stocks, while VOO reflects the dominance of top-weighted holdings. Investors might monitor this ratio to gauge market sentiment, with RSP historically showing higher expense ratios (around 0.20%) compared to VOO's lower fees (about 0.03%), but offering potentially better risk-adjusted returns in certain environments.1.6秒
Script open-source
Dans l'esprit TradingView, le créateur de ce script l'a rendu open source afin que les traders puissent examiner et vérifier ses fonctionnalités. Bravo à l'auteur! Bien que vous puissiez l'utiliser gratuitement, n'oubliez pas que la republication du code est soumise à nos Règles.
Clause de non-responsabilité
Les informations et publications ne sont pas destinées à être, et ne constituent pas, des conseils ou recommandations financiers, d'investissement, de trading ou autres fournis ou approuvés par TradingView. Pour en savoir plus, consultez les Conditions d'utilisation.