Mayfair Heatmap Volume 1.0
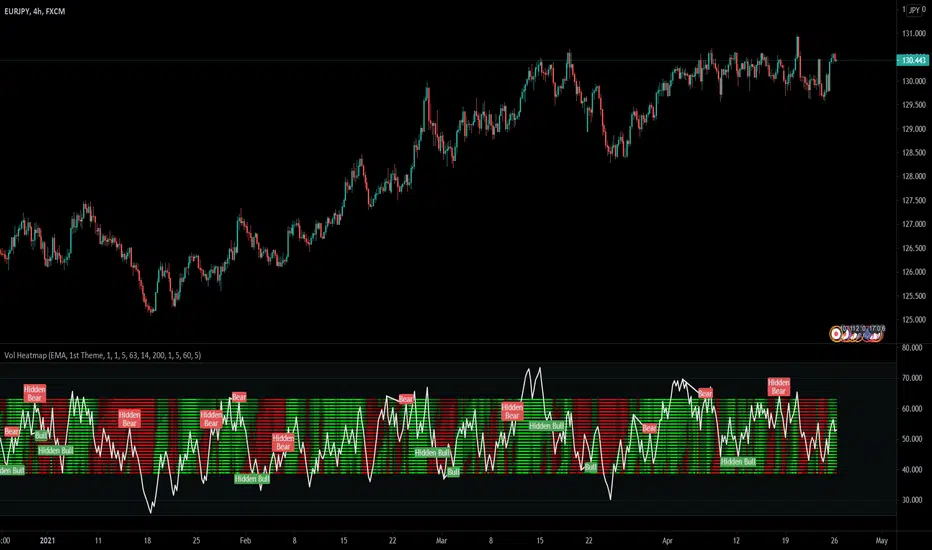
The heatmap area represents buying and selling pressure.
The white line works like a volume-driven RSI indicator, indicating overbought/oversold situations.
There is also a divergence indicator, represented by the Bear/Bull Hidden Bear/Hidden Bull markers, which show where the price action and the indicator's direction are moving in different directions.
Like all indicators, it is not perfect, and you should never rely on one indicator in any situation, but this one alerts you to opportunities, which you can then study on lower timeframes to find an entry.
Script sur invitation seulement
Seuls les utilisateurs approuvés par l'auteur peuvent accéder à ce script. Vous devrez demander et obtenir l'autorisation pour l'utiliser. Celle-ci est généralement accordée après paiement. Pour plus de détails, suivez les instructions de l'auteur ci-dessous ou contactez directement Paul_Varcoe.
TradingView ne recommande PAS d'acheter ou d'utiliser un script à moins que vous ne fassiez entièrement confiance à son auteur et que vous compreniez son fonctionnement. Vous pouvez également trouver des alternatives gratuites et open source dans nos scripts communautaires.
Instructions de l'auteur
THE CITY TRADERS: thecitytraders.com/?aff=9
Discord: discord.gg/Ma7SnExcWA
Clause de non-responsabilité
Script sur invitation seulement
Seuls les utilisateurs approuvés par l'auteur peuvent accéder à ce script. Vous devrez demander et obtenir l'autorisation pour l'utiliser. Celle-ci est généralement accordée après paiement. Pour plus de détails, suivez les instructions de l'auteur ci-dessous ou contactez directement Paul_Varcoe.
TradingView ne recommande PAS d'acheter ou d'utiliser un script à moins que vous ne fassiez entièrement confiance à son auteur et que vous compreniez son fonctionnement. Vous pouvez également trouver des alternatives gratuites et open source dans nos scripts communautaires.
Instructions de l'auteur
THE CITY TRADERS: thecitytraders.com/?aff=9
Discord: discord.gg/Ma7SnExcWA