OPEN-SOURCE SCRIPT
Trend Analyzer
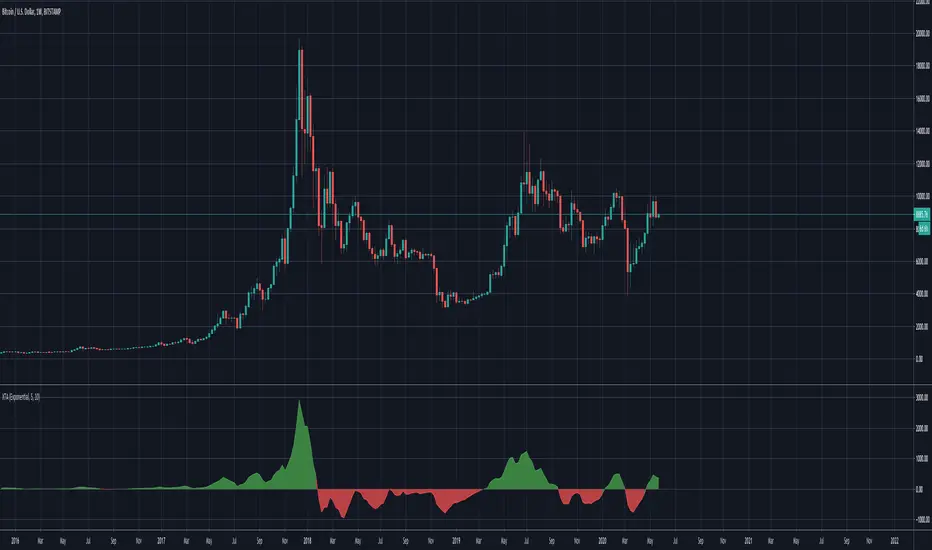
A simple script that plots difference between 2 moving averages and depicts convergance/divergance in color coded format.
Anything <= 0 is red and shows a bearish trend whereas > 0 is green and shows bullish trend.
Adjust the input parameters as following for your preferred time frame :
Anything <= 0 is red and shows a bearish trend whereas > 0 is green and shows bullish trend.
Adjust the input parameters as following for your preferred time frame :
- 4-Hr: Exponential, 15, 30
- Daily: Exponential, 10, 20
- Weekly: Exponential, 5, 10
Script open-source
Dans l'esprit TradingView, le créateur de ce script l'a rendu open source afin que les traders puissent examiner et vérifier ses fonctionnalités. Bravo à l'auteur! Bien que vous puissiez l'utiliser gratuitement, n'oubliez pas que la republication du code est soumise à nos Règles.
Clause de non-responsabilité
Les informations et publications ne sont pas destinées à être, et ne constituent pas, des conseils ou recommandations financiers, d'investissement, de trading ou autres fournis ou approuvés par TradingView. Pour en savoir plus, consultez les Conditions d'utilisation.