PROTECTED SOURCE SCRIPT
Mis à jour LuauDesign's Bull & Bear Runs Support and Resistance

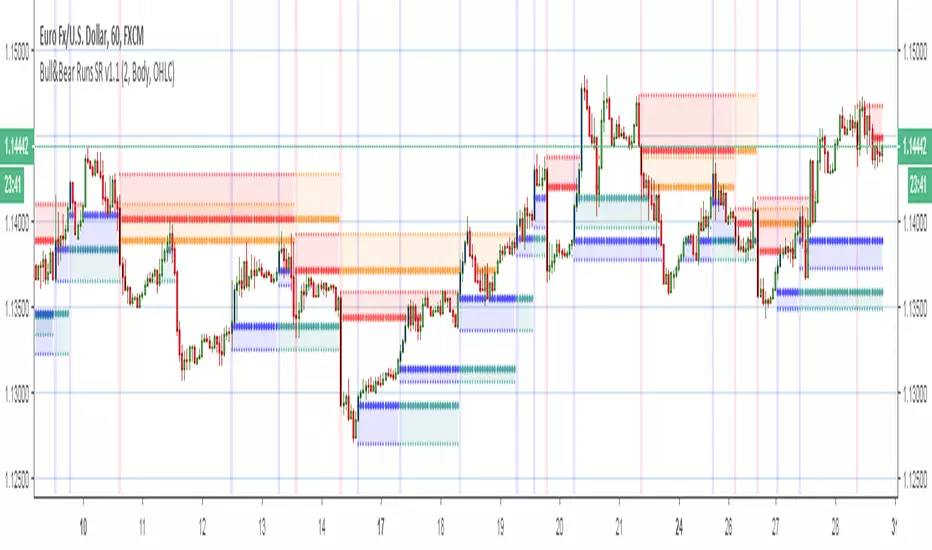
Support and Resistance Zones

This automates the way I look at drawing Support and Resistance. Different settings make it catch different moves.

It isn't perfect. It doesn't spot everything it should. But it spots some stuff it should, and can be tweaked with the different settings to see different things.

The zones are short-lived. They bound once, twice at best, and sometimes he bounce is very weak and quickly overtaken.


Hope this is useful to someone.
This automates the way I look at drawing Support and Resistance. Different settings make it catch different moves.
It isn't perfect. It doesn't spot everything it should. But it spots some stuff it should, and can be tweaked with the different settings to see different things.
The zones are short-lived. They bound once, twice at best, and sometimes he bounce is very weak and quickly overtaken.
Hope this is useful to someone.
Notes de version
The original one had scale defaulting to the left of the chart, and that'd cause problems when more than one indicator was present.I also changed the color of the bullish engulfments from yellow to blue, to keep it consistent with other SR scripts I'm working on.
Script protégé
Ce script est publié en source fermée. Toutefois, vous pouvez l'utiliser librement et sans aucune restriction - en savoir plus ici.
Clause de non-responsabilité
Les informations et les publications ne sont pas destinées à être, et ne constituent pas, des conseils ou des recommandations en matière de finance, d'investissement, de trading ou d'autres types de conseils fournis ou approuvés par TradingView. Pour en savoir plus, consultez les Conditions d'utilisation.