OPEN-SOURCE SCRIPT
Mayer MA
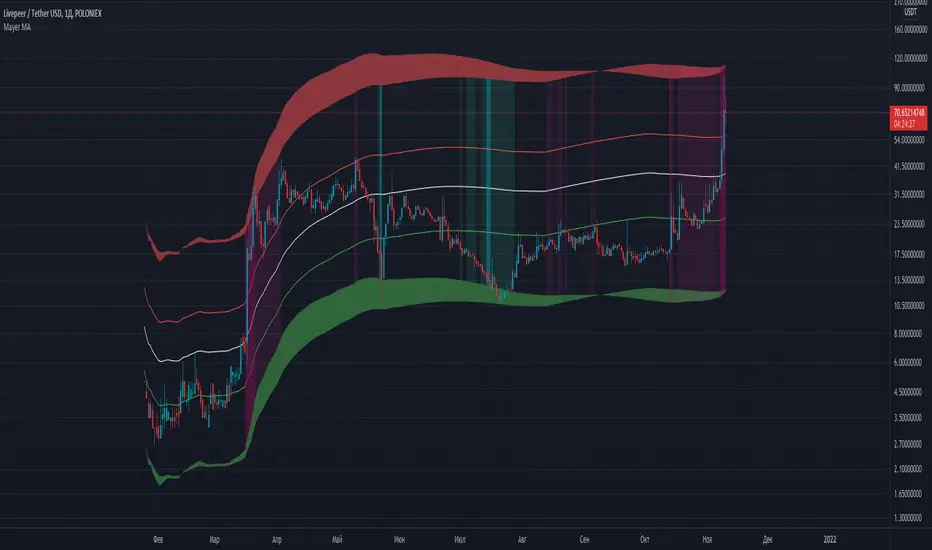
Mayer Multiple Price Bands Explained
The Mayer Multiple Price Bands chart is a simple modification to the original Mayer Multiple chart explained here.
Summary of Mayer Multiple
The Mayer Multiple is calculated by taking the price of Bitcoin and dividing it by the 200 day moving average value. The thinking behind the multiple is that by comparing the current price of bitcoin and its longer term moving average, you get a sense of if it is overbought (overvalued) or oversold (undervalued).
Adding Bands
The addition of price bands takes the multiple a step further by attempting to tell you how overbought or oversold bitcoin is with more detail. Instead of just three labels (overbought, fairly priced, and undervalued), you are given more granular labels: Oversold, Bearish, Bullish, Bullish Extension, and Overbought.
How to Calculate Mayer Multiple Bands
The Mayer multiple is calculated by taking the price of Bitcoin and dividing it by the 200 day moving average value. We take this a step further and display various prices that represent ‘bands’ of over and undervalued Bitcoin based on the multiple. They are as follows:
>2.5x: Overbought
>1.7x and <2.5x: Bullish Overextension
>1.1x and <1.7x Bullish Channel
>0.55x and <1.1x: Bearish Channel
<0.55x: Oversold
Script open-source
Dans l'esprit TradingView, le créateur de ce script l'a rendu open source afin que les traders puissent examiner et vérifier ses fonctionnalités. Bravo à l'auteur! Bien que vous puissiez l'utiliser gratuitement, n'oubliez pas que la republication du code est soumise à nos Règles.
Clause de non-responsabilité
Les informations et publications ne sont pas destinées à être, et ne constituent pas, des conseils ou recommandations financiers, d'investissement, de trading ou autres fournis ou approuvés par TradingView. Pour en savoir plus, consultez les Conditions d'utilisation.