OPEN-SOURCE SCRIPT
Infinity Market Grid -Aynet
Concept
Imagine viewing the market as a dynamic grid where price, time, and momentum intersect to reveal infinite possibilities. This indicator leverages:
Grid-Based Market Flow: Visualizes price action as a grid with zones for:
Accumulation
Distribution
Breakout Expansion
Volatility Compression
Predictive Dynamic Layers:
Forecasts future price zones using historical volatility and momentum.
Tracks event probabilities like breakout, fakeout, and trend reversals.
Data Science Visuals:
Uses heatmap-style layers, moving waveforms, and price trajectory paths.
Interactive Alerts:
Real-time alerts for high-probability market events.
Marks critical zones for "buy," "sell," or "wait."
Key Features
Market Layers Grid:
Creates dynamic "boxes" around price using fractals and ATR-based volatility.
These boxes show potential future price zones and probabilities.
Volatility and Momentum Waves:
Overlay volatility oscillators and momentum bands for directional context.
Dynamic Heatmap Zones:
Colors the chart dynamically based on breakout probabilities and risk.
Price Path Prediction:
Tracks price trajectory as a moving "wave" across the grid.
How It Works
Grid Box Structure:
Upper and lower price levels are based on ATR (volatility) and plotted dynamically.
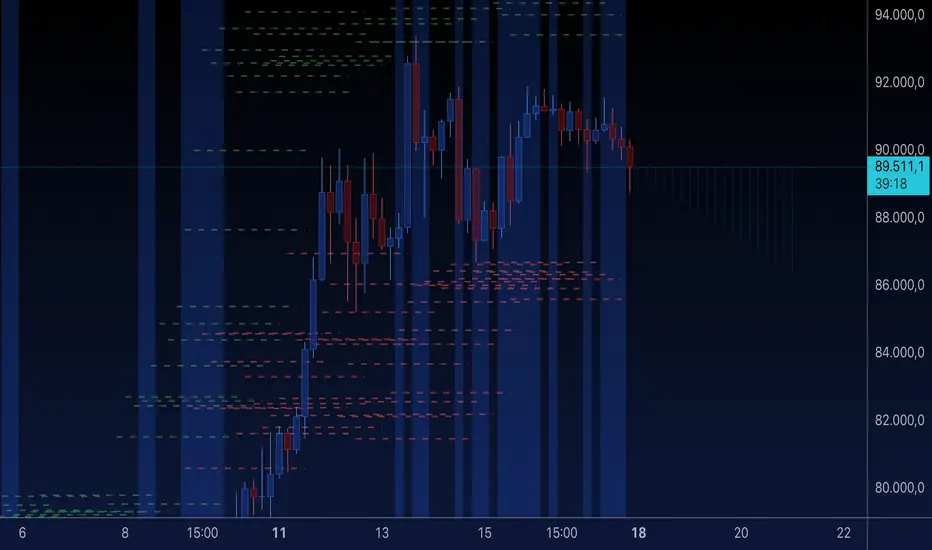
Dashed green/red lines show the grid for potential price expansion zones.
Heatmap Zones:
Colors the background based on probabilities:
Green: High breakout probability.
Blue: High consolidation probability.
Price Path Prediction:
Forecasts future price movements using momentum.
Plots these as a dynamic "wave" on the chart.
Momentum and Volatility Waves:
Shows the relationship between momentum and volatility as oscillating waves.
Helps identify when momentum exceeds volatility (potential breakouts).
Buy/Sell Signals:
Triggers when price approaches grid edges with strong momentum.
Provides alerts and visual markers.
Why Is It Revolutionary?
Grid and Wave Synergy:
Combines structural price zones (grid boxes) with real-time momentum and volatility waves.
Predictive Analytics:
Uses momentum-based forecasting to visualize what’s next, not just what’s happening.
Dynamic Heatmap:
Creates a living map of breakout/consolidation zones in real-time.
Scalable for Any Market:
Works seamlessly with forex, crypto, and stocks by adjusting the ATR multiplier and box length.
This indicator is not just a tool but a framework for understanding market dynamics at a deeper level. Let me know if you'd like to take it even further — for example, adding machine learning-inspired probability models or multi-timeframe analysis! 🚀
Imagine viewing the market as a dynamic grid where price, time, and momentum intersect to reveal infinite possibilities. This indicator leverages:
Grid-Based Market Flow: Visualizes price action as a grid with zones for:
Accumulation
Distribution
Breakout Expansion
Volatility Compression
Predictive Dynamic Layers:
Forecasts future price zones using historical volatility and momentum.
Tracks event probabilities like breakout, fakeout, and trend reversals.
Data Science Visuals:
Uses heatmap-style layers, moving waveforms, and price trajectory paths.
Interactive Alerts:
Real-time alerts for high-probability market events.
Marks critical zones for "buy," "sell," or "wait."
Key Features
Market Layers Grid:
Creates dynamic "boxes" around price using fractals and ATR-based volatility.
These boxes show potential future price zones and probabilities.
Volatility and Momentum Waves:
Overlay volatility oscillators and momentum bands for directional context.
Dynamic Heatmap Zones:
Colors the chart dynamically based on breakout probabilities and risk.
Price Path Prediction:
Tracks price trajectory as a moving "wave" across the grid.
How It Works
Grid Box Structure:
Upper and lower price levels are based on ATR (volatility) and plotted dynamically.
Dashed green/red lines show the grid for potential price expansion zones.
Heatmap Zones:
Colors the background based on probabilities:
Green: High breakout probability.
Blue: High consolidation probability.
Price Path Prediction:
Forecasts future price movements using momentum.
Plots these as a dynamic "wave" on the chart.
Momentum and Volatility Waves:
Shows the relationship between momentum and volatility as oscillating waves.
Helps identify when momentum exceeds volatility (potential breakouts).
Buy/Sell Signals:
Triggers when price approaches grid edges with strong momentum.
Provides alerts and visual markers.
Why Is It Revolutionary?
Grid and Wave Synergy:
Combines structural price zones (grid boxes) with real-time momentum and volatility waves.
Predictive Analytics:
Uses momentum-based forecasting to visualize what’s next, not just what’s happening.
Dynamic Heatmap:
Creates a living map of breakout/consolidation zones in real-time.
Scalable for Any Market:
Works seamlessly with forex, crypto, and stocks by adjusting the ATR multiplier and box length.
This indicator is not just a tool but a framework for understanding market dynamics at a deeper level. Let me know if you'd like to take it even further — for example, adding machine learning-inspired probability models or multi-timeframe analysis! 🚀
Script open-source
Dans l'esprit TradingView, le créateur de ce script l'a rendu open source afin que les traders puissent examiner et vérifier ses fonctionnalités. Bravo à l'auteur! Bien que vous puissiez l'utiliser gratuitement, n'oubliez pas que la republication du code est soumise à nos Règles.
Clause de non-responsabilité
Les informations et publications ne sont pas destinées à être, et ne constituent pas, des conseils ou recommandations financiers, d'investissement, de trading ou autres fournis ou approuvés par TradingView. Pour en savoir plus, consultez les Conditions d'utilisation.