OPEN-SOURCE SCRIPT
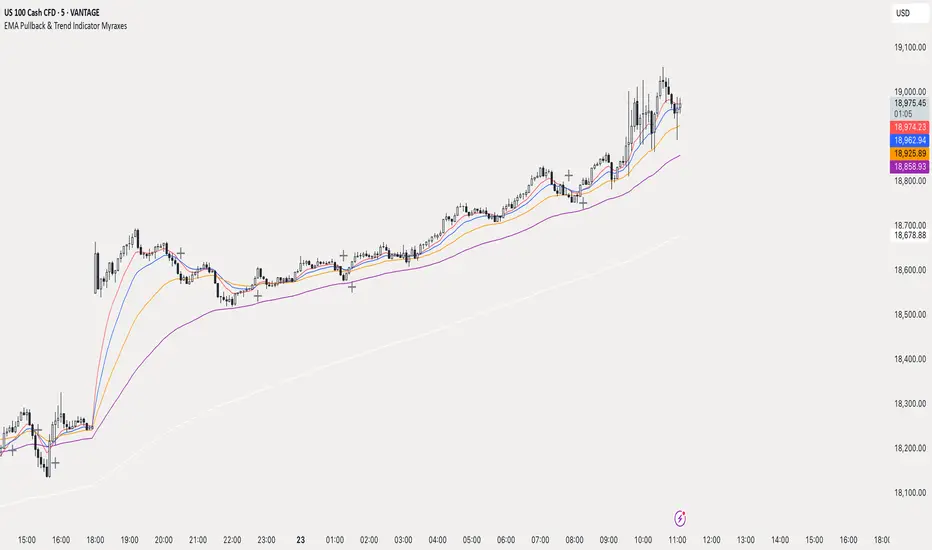
EMA Pullback & Trend Indicator Myraxes
EMA Pullback & Trend Indicator by Max Retri
Plots five EMAs—9, 15, 30, 65 and 200—and draws clean, easy-to-interpret signals when the fast EMAs cross in the direction of the longer-term trend. No other indicators or overlays are required; simply add it to your chart and watch for the arrows and crosses.
⸻
What It Does & How It Works
1. EMAs & Colors
2. Trend Filter
3. Pullback Requirement
4. Signal Logic
⸻
How to Use
Because it’s a pure‐EMA indicator (no heavy calculations), it runs quickly even on lower-end machines.
Plots five EMAs—9, 15, 30, 65 and 200—and draws clean, easy-to-interpret signals when the fast EMAs cross in the direction of the longer-term trend. No other indicators or overlays are required; simply add it to your chart and watch for the arrows and crosses.
⸻
What It Does & How It Works
1. EMAs & Colors
- • Red (EMA 9) – Fast signal line
- • Blue (EMA 15) – Confirmation line
- • Orange (EMA 30) – Pullback zone 1
- • Purple (EMA 65) – Pullback zone 2 & mid-term trend
- • White (EMA 200) – Long-term trend
2. Trend Filter
- • Bullish regime when price is above both EMA 65 and EMA 200.
- • Bearish regime when price is below both EMA 65 and EMA 200.
3. Pullback Requirement
- • Only consider a signal if price has retraced into the EMA 30 or EMA 65 zone.
4. Signal Logic
- Long Entry ▲: EMA 9 (red) crosses above EMA 15 (blue) while in a bullish regime and after a pullback into EMA 30/65.
- Short Entry ▼: EMA 9 crosses below EMA 15 while in a bearish regime and after a retracement up to EMA 30/65.
- Exit ✖: Opposite EMA 9/15 crossover marks the close of the position.
⸻
How to Use
- 1. Add the indicator to any chart/timeframe.
- 2. Identify trend: make sure price is aligned above or below the 65 and 200 EMAs.
- 3. Watch for pullbacks into the orange or purple EMAs.
- 4. Enter on the black ▲ or ▼ arrow.
- 5. Exit when you see the gray ✖ cross.
Because it’s a pure‐EMA indicator (no heavy calculations), it runs quickly even on lower-end machines.
Script open-source
Dans l'esprit TradingView, le créateur de ce script l'a rendu open source afin que les traders puissent examiner et vérifier ses fonctionnalités. Bravo à l'auteur! Bien que vous puissiez l'utiliser gratuitement, n'oubliez pas que la republication du code est soumise à nos Règles.
Clause de non-responsabilité
Les informations et publications ne sont pas destinées à être, et ne constituent pas, des conseils ou recommandations financiers, d'investissement, de trading ou autres fournis ou approuvés par TradingView. Pour en savoir plus, consultez les Conditions d'utilisation.