OPEN-SOURCE SCRIPT
Mis à jour M2 Global Liquidity Index - X Days Lead

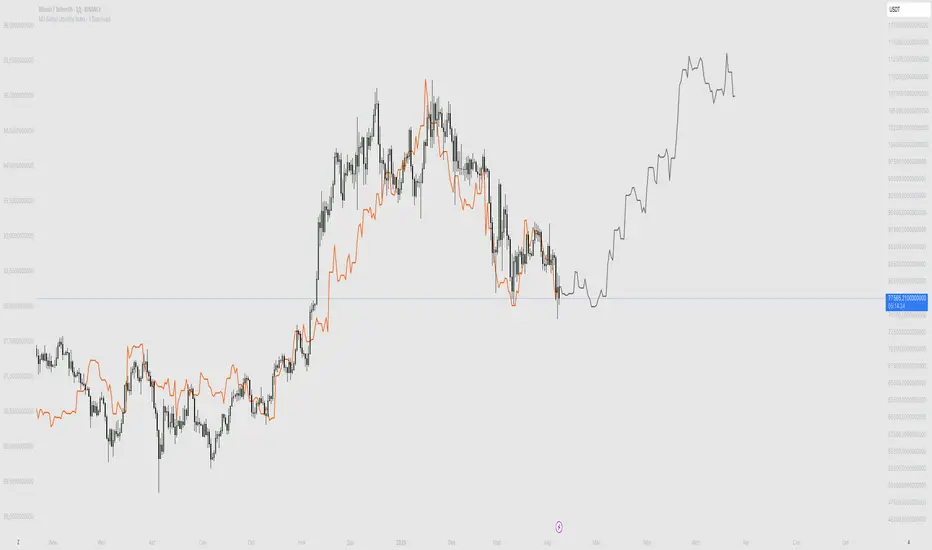
This custom indicator overlays the Bitcoin price chart with the Global Liquidity M2 chart, providing a unique perspective on how monetary supply might influence Bitcoin's price movements. The indicator distinguishes between past and future segments of the liquidity data using two distinct colors.
- Past Segment: The portion of the Global Liquidity M2 chart that has already passed is displayed in one color, allowing users to assess historical correlations with Bitcoin's price.
- Future Segment: The upcoming part of the liquidity chart is shown in a different color, offering insights into potential future impacts on Bitcoin's price trajectory.
by walkin
Notes de version
This custom indicator overlays the Bitcoin price chart with the Global Liquidity M2 chart, providing a unique perspective on how monetary supply might influence Bitcoin's price movements. The indicator distinguishes between past and future segments of the liquidity data using two distinct colors.- Past Segment: The portion of the Global Liquidity M2 chart that has already passed is displayed in one color, allowing users to assess historical correlations with Bitcoin's price.
- Future Segment: The upcoming part of the liquidity chart is shown in a different color, offering insights into potential future impacts on Bitcoin's price trajectory.
by walkin
Script open-source
Dans l'esprit TradingView, le créateur de ce script l'a rendu open source afin que les traders puissent examiner et vérifier ses fonctionnalités. Bravo à l'auteur! Bien que vous puissiez l'utiliser gratuitement, n'oubliez pas que la republication du code est soumise à nos Règles.
Clause de non-responsabilité
Les informations et publications ne sont pas destinées à être, et ne constituent pas, des conseils ou recommandations financiers, d'investissement, de trading ou autres fournis ou approuvés par TradingView. Pour en savoir plus, consultez les Conditions d'utilisation.