Knowing how to work with the datas in a company's financial statements is an essential skill for stock investors. The meaningful interpretation and analysis of balance sheets, income statements, and cash flow statements to discern a company's investment qualities is the basis for smart investment choices.
You can access to the financials tables of the companies as a summary with this indicator.
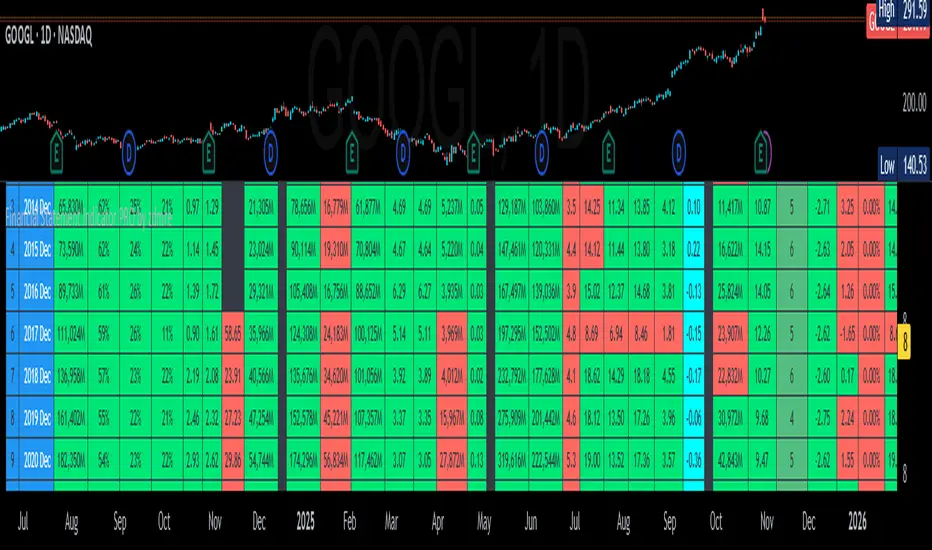
3 Tables;
Income Statement Table:
Revenue
Net Profit
EPS
EPS-D
P/E
Balance Sheet Table:
Current Asset
Total Asset
Total Equity
Book Value per Share
Total Debt
Debt/Equity
Statistics & Cash Flow Table:
Return On Equity
Return On Asset
Return On Invested Capital
Quick Ratio
Free Cash Flow
You can access to the financials tables of the companies as a summary with this indicator.
3 Tables;
Income Statement Table:
Revenue
Net Profit
EPS
EPS-D
P/E
Balance Sheet Table:
Current Asset
Total Asset
Total Equity
Book Value per Share
Total Debt
Debt/Equity
Statistics & Cash Flow Table:
Return On Equity
Return On Asset
Return On Invested Capital
Quick Ratio
Free Cash Flow
Notes de version
- Added Tooltips
Added Filtering Data by Color
Fixed P/E Ratio
Notes de version
- Added editable Text Color option.
Notes de version
Fixed "FUND Error"Added EPS-D & P/E (Plot Data)
Notes de version
Fixed Basic EPS
P/E Ratio
Notes de version
- Added BETA Value and improvements made to the visuals.
Notes de version
Removed
- BVPS (Book Value Per Share)
Added
*P/B (Price-to-Book Ratio)
*ROE/PB (Return on Equity / Price-to-Book Ratio)
*EPS Est (Earning Per Share Estimated)
Notes de version
- Fixed Earnings Date problem.
Notes de version
Added 4th Table and improvements made to the visuals.Statistics (Others):
Dividend Payout
Dividend Yield
PEG Ratio
PE Ratio (Forward 1y)
Sustainable Growth Rate (SGR)
Altman Z-SCORE
Beneish Model
Graham Number
Piotroski Score
Springate Score
Zmijewski Score
Notes de version
New design - Added Headers
Added Tooltips for Titles
Table & Cell merging
Notes de version
Added Net Margin / Operating Margin FilterHidden NaN values
Notes de version
- Some additions have been made to the Plot data.
- The EPS data has been changed from Basic to Diluted.
- Minor UI improvements.
Notes de version
Bug fixes.Notes de version
What's New? I've added four critical metrics:
- Gross Margin
- Current Ratio
- Working Capital
- EBITDA
What's Improved?
Tables Reorganized: I've completely restructured the data into 4 logical tables (Profitability, Financial Health, Performance, Advanced Analytics) to make the analysis flow better.
Better Visuals: The color-coding system is now more consistent. The gradients for the Altman Z-Score and Piotroski F-Score are now much more informative.
More Data: You can now analyze 24 periods instead of 10.
Configurable Beta: You can now change the benchmark (default is SPX).
All settings menus and tooltips have been cleaned up to be more understandable.
What's Removed?
I removed a few metrics to streamline the analysis and reduce clutter:
Graham Numbers: Limited practical use in modern analysis.
Dividend Payout Ratio: Dividend Yield already covers this.
Technical Fixes
Cleaned up and optimized the code in the background.
Fixed several minor bugs related to color logic, NA value handling, and array indexing.
Script open-source
Dans l'esprit TradingView, le créateur de ce script l'a rendu open source afin que les traders puissent examiner et vérifier ses fonctionnalités. Bravo à l'auteur! Bien que vous puissiez l'utiliser gratuitement, n'oubliez pas que la republication du code est soumise à nos Règles.
Clause de non-responsabilité
Les informations et publications ne sont pas destinées à être, et ne constituent pas, des conseils ou recommandations financiers, d'investissement, de trading ou autres fournis ou approuvés par TradingView. Pour en savoir plus, consultez les Conditions d'utilisation.