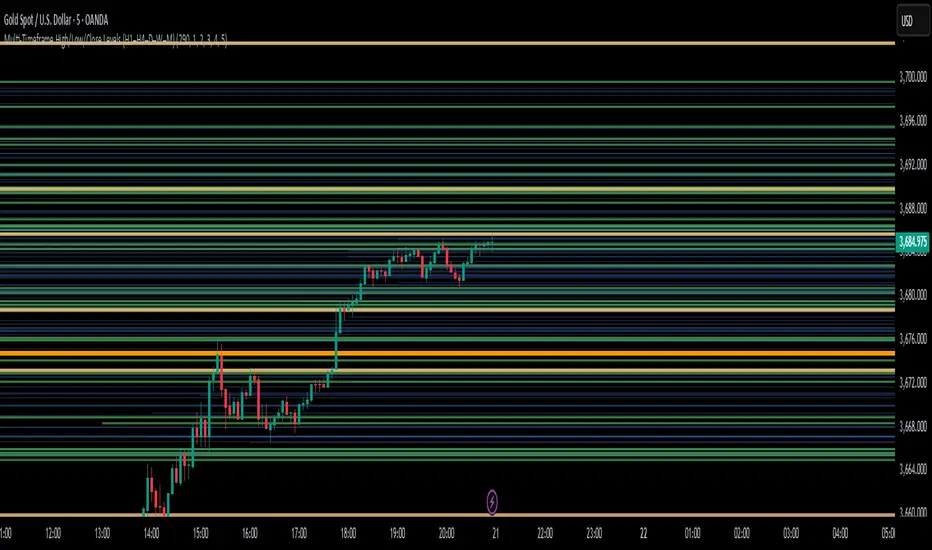
Multi-Timeframe High/Low/Close Levels (H1–H4–D–W–M)
H1 (1-Hour)
H4 (4-Hour)
Daily (1-Day)
Weekly (1-Week)
Monthly (1-Month)
Key Features:
Draws High, Low, and Close levels for each timeframe.
Each level starts from its own candle and extends to the right.
Levels are filtered to stay close to the current price, keeping the chart clean.
Automatic line management ensures that the total number of levels never exceeds the user-defined limit (default: 300, adjustable up to 400).
Customizable colors, widths, and visibility for each timeframe in the Style tab.
Usage:
Use these levels as dynamic support and resistance zones.
Higher-timeframe levels are drawn with stronger colors and thicker lines, giving visual priority over lower-timeframe levels.
Script sur invitation seulement
Seuls les utilisateurs approuvés par l'auteur peuvent accéder à ce script. Vous devrez demander et obtenir l'autorisation pour l'utiliser. Celle-ci est généralement accordée après paiement. Pour plus de détails, suivez les instructions de l'auteur ci-dessous ou contactez directement Vahid_Sehat.
TradingView ne recommande PAS d'acheter ou d'utiliser un script à moins que vous ne fassiez entièrement confiance à son auteur et que vous compreniez son fonctionnement. Vous pouvez également trouver des alternatives gratuites et open source dans nos scripts communautaires.
Instructions de l'auteur
Clause de non-responsabilité
Script sur invitation seulement
Seuls les utilisateurs approuvés par l'auteur peuvent accéder à ce script. Vous devrez demander et obtenir l'autorisation pour l'utiliser. Celle-ci est généralement accordée après paiement. Pour plus de détails, suivez les instructions de l'auteur ci-dessous ou contactez directement Vahid_Sehat.
TradingView ne recommande PAS d'acheter ou d'utiliser un script à moins que vous ne fassiez entièrement confiance à son auteur et que vous compreniez son fonctionnement. Vous pouvez également trouver des alternatives gratuites et open source dans nos scripts communautaires.