PROTECTED SOURCE SCRIPT
Mis à jour Market Profile
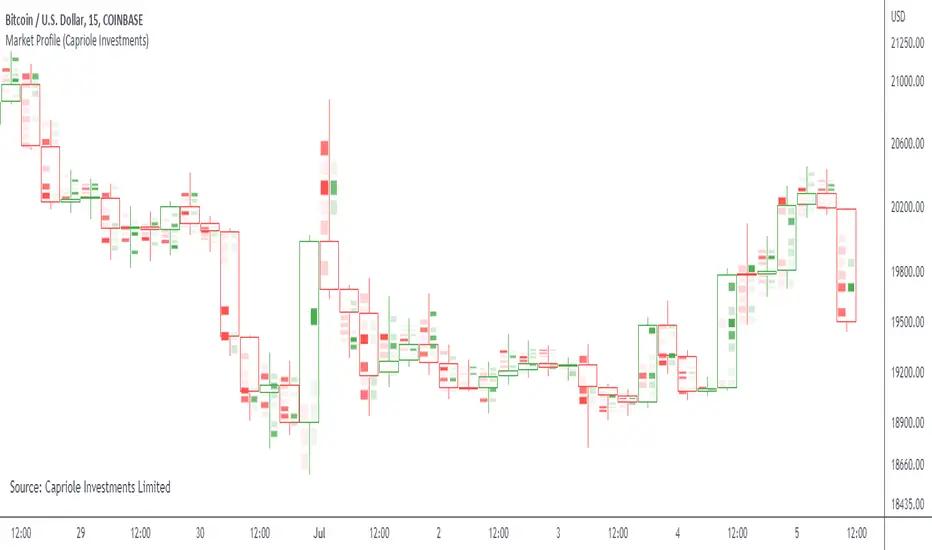
Simple "Market Profile" script to help visualize where high volume nodes are occurring on higher-time frame candles.
Historical lookback is visually limited based on the number of candles TradingView provides on the chosen timeframe.
The script calculates the buy/sell pressure on the timeframe chosen, and aggregates volume up to the higher timeframe of choice (default: 4hr).
The volume for each candle is then normalized to assess how many standard deviations away from the mean it is. The color gradient on the chart is stronger for readings with more extreme z-scores.
Readings which are less than 2-standard deviations from the mean are not colored (white) - making it easier to visualize where the extremities of volume occur only.
Recommend using on default settings, on the 5-min of 15-min chart. Then hide the normal price data by clicking the "eye" symbol.
If you want to visualize historic periods, you can change the lookback settings.
Notes de version
Sourcing updateScript protégé
Ce script est publié en source fermée. Cependant, vous pouvez l'utiliser librement et sans aucune restriction – pour en savoir plus, cliquez ici.
Clause de non-responsabilité
Les informations et publications ne sont pas destinées à être, et ne constituent pas, des conseils ou recommandations financiers, d'investissement, de trading ou autres fournis ou approuvés par TradingView. Pour en savoir plus, consultez les Conditions d'utilisation.
Script protégé
Ce script est publié en source fermée. Cependant, vous pouvez l'utiliser librement et sans aucune restriction – pour en savoir plus, cliquez ici.
Clause de non-responsabilité
Les informations et publications ne sont pas destinées à être, et ne constituent pas, des conseils ou recommandations financiers, d'investissement, de trading ou autres fournis ou approuvés par TradingView. Pour en savoir plus, consultez les Conditions d'utilisation.