PROTECTED SOURCE SCRIPT
Mis à jour Stochastic cross up/dn calculator (Picte)
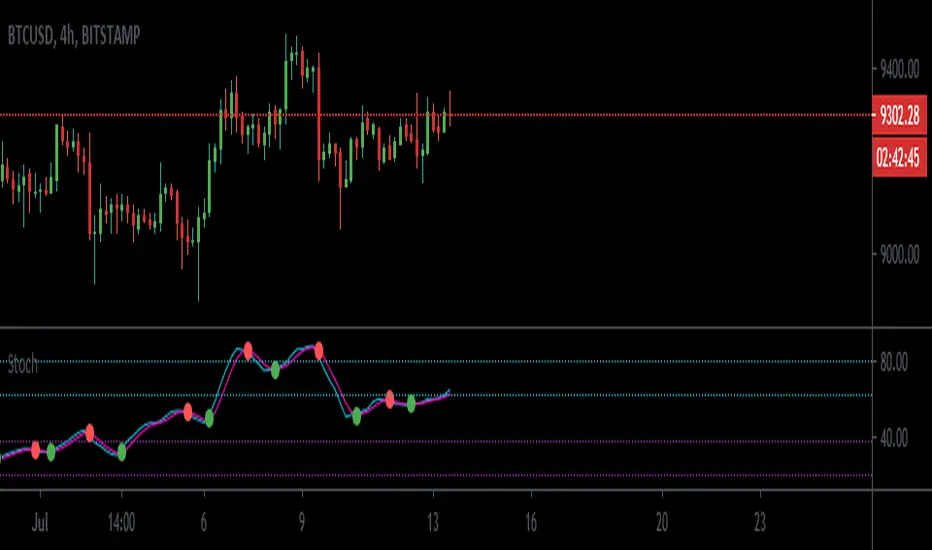
This indicator will calculate the estimated price needed for the stochastic oscillator to change direction. I also included some important horizontal levels for the oscillator. When the oscillator is stuck under the upper purple horizontal we are generally bearish and when it is stuck above the lower blue horizontal we are generally bullish.
The way i like to trade with this oscillator is to see it break a particular support/resistance line and buy/sell it on a retest. I will include some photos of signals i like to take with this indicator below.
I found it useful in the Forex market and also with bitcoin. The traditional market has yet to be tested. I would recommend it being used on time frames above the hourly. It does not mean that lower time frames can not work it is just that higher time frames offer better risk/reward ratio.
signal examples:

ENJOY :)
The way i like to trade with this oscillator is to see it break a particular support/resistance line and buy/sell it on a retest. I will include some photos of signals i like to take with this indicator below.
I found it useful in the Forex market and also with bitcoin. The traditional market has yet to be tested. I would recommend it being used on time frames above the hourly. It does not mean that lower time frames can not work it is just that higher time frames offer better risk/reward ratio.
signal examples:
ENJOY :)
Notes de version
crosses markedScript protégé
Ce script est publié en source fermée. Cependant, vous pouvez l'utiliser librement et sans aucune restriction – pour en savoir plus, cliquez ici.
Clause de non-responsabilité
Les informations et publications ne sont pas destinées à être, et ne constituent pas, des conseils ou recommandations financiers, d'investissement, de trading ou autres fournis ou approuvés par TradingView. Pour en savoir plus, consultez les Conditions d'utilisation.
Script protégé
Ce script est publié en source fermée. Cependant, vous pouvez l'utiliser librement et sans aucune restriction – pour en savoir plus, cliquez ici.
Clause de non-responsabilité
Les informations et publications ne sont pas destinées à être, et ne constituent pas, des conseils ou recommandations financiers, d'investissement, de trading ou autres fournis ou approuvés par TradingView. Pour en savoir plus, consultez les Conditions d'utilisation.