OPEN-SOURCE SCRIPT
Pearson vs Approx. Spearman Correlation
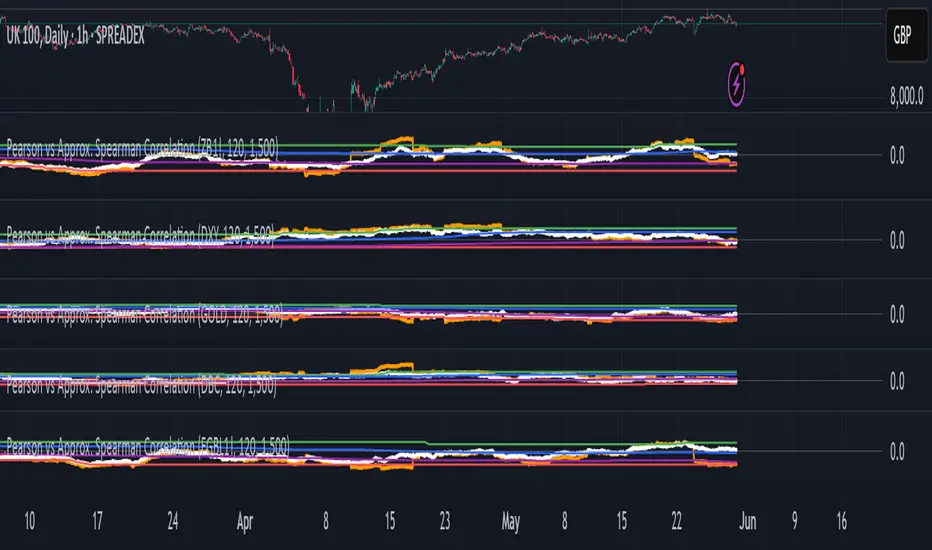
This indicator displays the rolling Pearson and approximate Spearman correlation between the chart's asset and a second user-defined asset, based on log returns over a customizable window.
Features:
- Pearson correlation of log returns (standard linear dependency measure)
- Approximate Spearman correlation, using percentile ranks to better capture nonlinear and monotonic relationships
/ Horizontal lines showing:
Maximum and minimum correlation values over a statistical window
1st quartile (25%) and 3rd quartile (75%) — helpful for identifying statistically high or low regimes
This script is useful for identifying dynamic co-movements, regime changes, or correlation breakdowns between assets — applicable in risk management, portfolio construction, and pairs trading strategies.
Script open-source
Dans l'esprit TradingView, le créateur de ce script l'a rendu open source afin que les traders puissent examiner et vérifier ses fonctionnalités. Bravo à l'auteur! Bien que vous puissiez l'utiliser gratuitement, n'oubliez pas que la republication du code est soumise à nos Règles.
Clause de non-responsabilité
Les informations et publications ne sont pas destinées à être, et ne constituent pas, des conseils ou recommandations financiers, d'investissement, de trading ou autres fournis ou approuvés par TradingView. Pour en savoir plus, consultez les Conditions d'utilisation.