INVITE-ONLY SCRIPT
SRSI Bands
Mis à jour
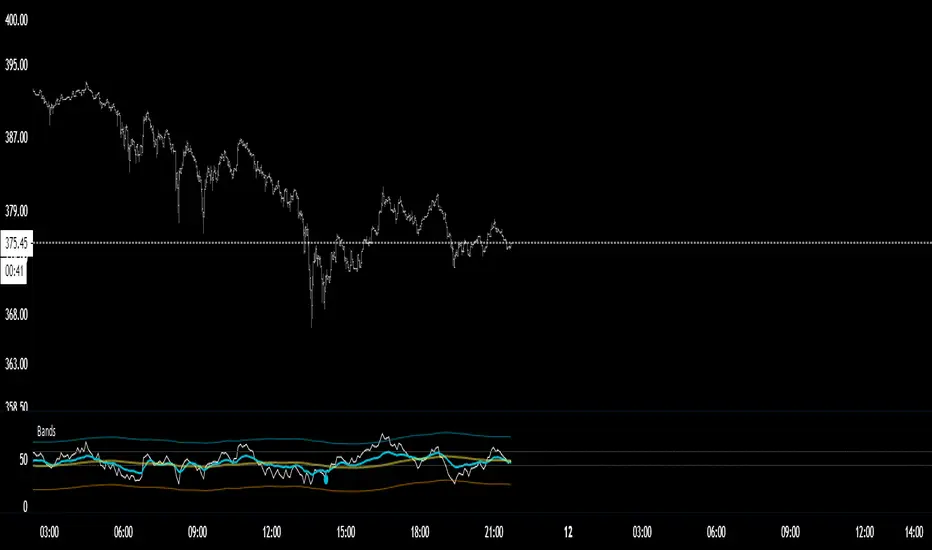
A modified version of SRSI
For some reason i had an idea to apply Bollinger Bands to my RSI but it never really worked so i decided to do something that gave me the exact context i wanted to see and that was a dynamic range that moved with the RSI
Instead of your standard fixed 80-20
Its simple
Same concepts apply as a regular RSI
What is key to know is that when RSI gets outside the band you are more likely to revers back inside the band which can provide for some really good take profit or entry points.
The blue line is the key line for overall momentum in regards to the mid band
when blue is above gold its bullish
When below its bearish
DM more for info on how to attain access.
Cheers
Notes de version
added signal line and standard range lines for RSI :)
Script sur invitation seulement
L'accès à ce script est limité aux utilisateurs autorisés par l'auteur et nécessite généralement un paiement. Vous pouvez l'ajouter à vos favoris, mais vous ne pourrez l'utiliser qu'après avoir demandé et obtenu l'autorisation de son auteur. Contactez SatoshiHeavy pour plus d'informations, ou suivez les instructions de l'auteur ci-dessous.
TradingView ne suggère pas de payer pour un script et de l'utiliser à moins que vous ne fassiez confiance à 100% à son auteur et que vous compreniez comment le script fonctionne. Dans de nombreux cas, vous pouvez trouver une bonne alternative open-source gratuite dans nos Scripts communautaires.
Vous voulez utiliser ce script sur un graphique ?
Avertissement: veuillez lire avant de demander l'accès.
Have a plan. Trade it!
Clause de non-responsabilité
Les informations et les publications ne sont pas destinées à être, et ne constituent pas, des conseils ou des recommandations en matière de finance, d'investissement, de trading ou d'autres types de conseils fournis ou approuvés par TradingView. Pour en savoir plus, consultez les Conditions d'utilisation.