OPEN-SOURCE SCRIPT
Average Range Convergence Divergence
Hi there,
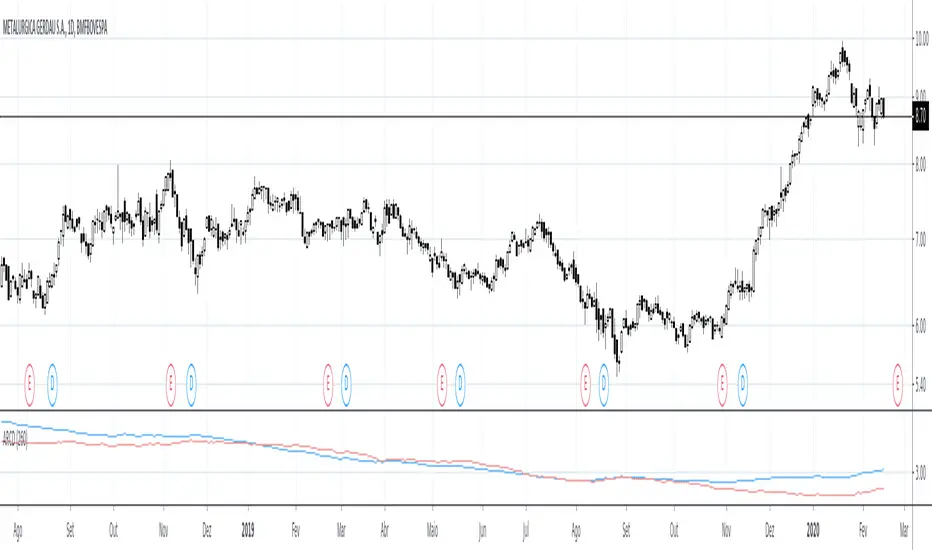
It's a script that plot the ATR (Average True Range) and ADR (Average Day Range) together and do an histogram of it. The histogram is the difference from ATR to ADR, I believe that it shows the average GAP in the asset. So I can easily found the offset to use when defining my stop.
PT
Esse script desenha o ATR (no profit True Range) e o ADR (media da diferença entre máximas e minimas) junto da diferença entre essas médias em formato de histograma. O gap médio de um ativo é mostrado no histograma.
Script open-source
Dans l'esprit TradingView, le créateur de ce script l'a rendu open source afin que les traders puissent examiner et vérifier ses fonctionnalités. Bravo à l'auteur! Bien que vous puissiez l'utiliser gratuitement, n'oubliez pas que la republication du code est soumise à nos Règles.
Clause de non-responsabilité
Les informations et publications ne sont pas destinées à être, et ne constituent pas, des conseils ou recommandations financiers, d'investissement, de trading ou autres fournis ou approuvés par TradingView. Pour en savoir plus, consultez les Conditions d'utilisation.