OPEN-SOURCE SCRIPT
Mis à jour Kitti-Playbook Fibonacci retracement GAGE R0.00

Release Notes: Oct 25 2021
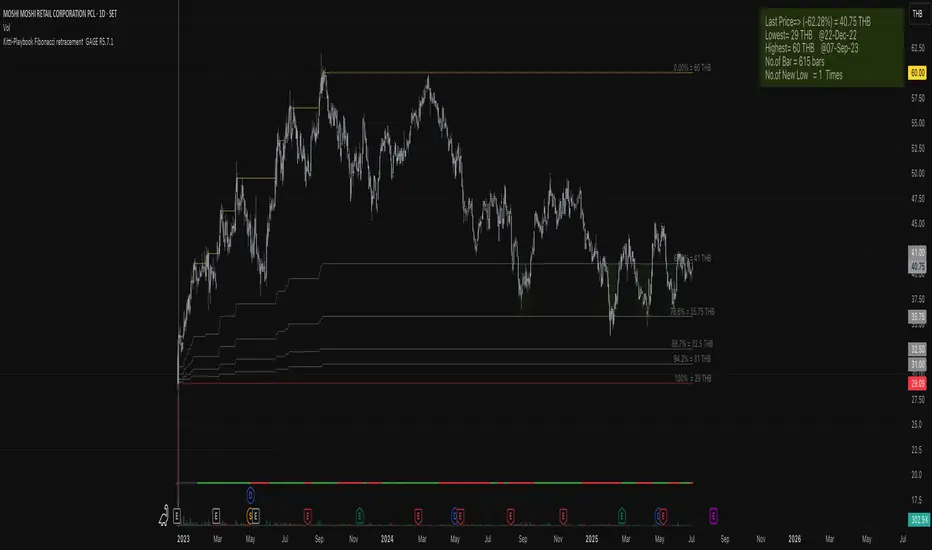
OVERVIEW :Kitti-Playbook Fibonacci retracement GAGE R0.00
Easy for visualize Fibonacci retracement level
CONCEPTS
1)Minimum Line = Lowest level of Source form start
2)Maximum Line = Highest level of Source form New Low
3)Calculation
a) Fibonacci Retracement of 61.8% form Maximum level
b) Fibonacci Retracement of 78.6% form Maximum level
c) Fibonacci Retracement of 88.7% form Maximum level
d) Fibonacci Retracement of 94.2% form Maximum level
4)Information Display
a) Information Bar show Number of New Low , Max level , Min Level , Last Bar No, Current Pricel
b) GAGE Scale Number
c) New Low
Notes de version
Debug : Source information error for 94.2% retracementNotes de version
1)Addition line at Botom Bullish = Green color , Condition = EMA 12 > EMA 26
Bearish = Red color , Condition = EMA 12 < EMA 26
2) Introduce New Input Setting Menu for easy to color Zone customize
Notes de version
Date Feb 28 2023 Addition : Color of Label change follow conditions as follow
If last Price is lower than the New highest price - color gray
If last Price is lower than 61.8% of the New highest price - color Bule
If last Price is lower than 78.6% of the New highest price - color Green
If last Price is lower than 94.2% of the New highest price - color Yellow
Notes de version
Update Chart Andchange color
If last Price is lower than 61.8% of the New highest price - color Blue to Orange
Notes de version
Date Apr 11 2023 R41) Addition Setting TEXT size menu for display Fibonacci Value and currency
2) Addition Unit of Currency for display Fibonacci Value and currency
3) Debug for small digit currency display for 2 digit to Mintick
4) Debug Source of Price for calculate fibonacci
Notes de version
Date Apr 12 2023 R0.041Debug label 61.,8% --> 61.8%
Notes de version
Date Jul 24 20231 Change Setting Menu of Fibonacci color Zone
2 The color of background of label is change follow setting of Fibonacci zone color setting
3 Able to Adjust Label Text Size
Notes de version
Date April 24 2024 R4.411 Add Show Symbols
Notes de version
Date April 25 20241)Setting the Source for calculating the Min value for the time frames W, M will be set to Low automatically (cannot be changed).
2)Setting the Source for calculating the Max value for the time frames W, M will be set to High automatically (cannot be changed).
3)Add Show Symbol + % of Last Price
Notes de version
Date May 18 20241) Add Setting for Adjust Position left - right of Fibonacci value
2) Change def. of color fill
Notes de version
Date May 18 2024 R4.5.2->Debug Setting for Adjust Position left - right of Fibonacci value
Notes de version
Date: Jun 8 2024Add function to display Fibonacci Target Zone
Add background when price continue making New Low
Notes de version
Date : Jun 21 2024 R6.4.2Add Date : for Max price and Min Price
Change format of Fibonacci percentage from ##% to ##.##%
Renew Table display
Debug in case last price error such as 12.999999999 => 13.00
Notes de version
Convert form Pine script Version5 to Pine script Version6Notes de version
Date: Dec 25 2024 R4.12.2Text Size : offering a more granular and wide range of text size possibilities by change number ( Text Size Auto = 0 )
Notes de version
Date : July 3 2025 R 5.7.1Debug : Abnormal condition when is first bar and no volume
Script open-source
Dans l'esprit TradingView, le créateur de ce script l'a rendu open source afin que les traders puissent examiner et vérifier ses fonctionnalités. Bravo à l'auteur! Bien que vous puissiez l'utiliser gratuitement, n'oubliez pas que la republication du code est soumise à nos Règles.
Clause de non-responsabilité
Les informations et publications ne sont pas destinées à être, et ne constituent pas, des conseils ou recommandations financiers, d'investissement, de trading ou autres fournis ou approuvés par TradingView. Pour en savoir plus, consultez les Conditions d'utilisation.