PROTECTED SOURCE SCRIPT
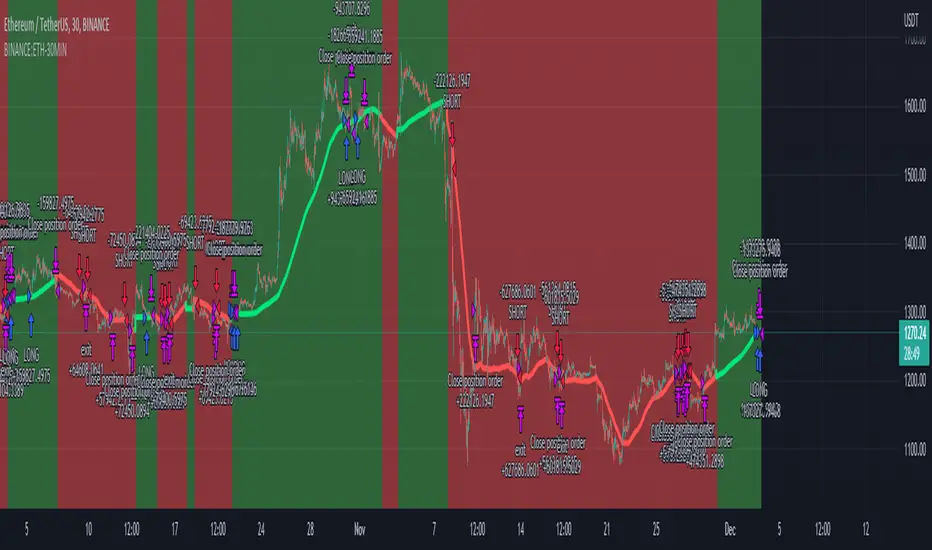
ETHUSDT Long-Short using EMA,OBV,ADX,LinearReg,DXY(No repaint)

This script strategy is used to follow the trending EMA with a delta difference (Price-EMA) to know when to enter and with 5 variables mentioned below, stop loss is below EMA line all the time in long and above EMA line in short, is like a trailing stop after candle is closed. Hard stop is also placed to prevent big candles movements, also correlation between VIX and ETH when the correlation is <-0.2 the position can be opened.
Indicators used:
EMA , OBV , ADX , Linear regression and Dollar Index trending, Leverage is available for Long and Short positions.
LONG
SHORT

 ETHUSDT 30 minutes Timeframe
Indicators used:
EMA , OBV , ADX , Linear regression and Dollar Index trending, Leverage is available for Long and Short positions.
LONG
- When Price is above EMA and price-ema difference is smaller than "Long delta Price/MA"
- OBV(4hrs) is above OBV-EMA(110)
- Linear regression is strong
- ADX is strong >50
- DXY is trending down
SHORT
- When Price is below EMA and ema-price difference is smaller than "Long delta Price/MA"
- OBV(4hrs) is below OBV-EMA(110)
- Linear regression is weak
- ADX is weak <50
- DXY is trending up
Script protégé
Ce script est publié en source fermée. Cependant, vous pouvez l'utiliser librement et sans aucune restriction – pour en savoir plus, cliquez ici.
Clause de non-responsabilité
Les informations et publications ne sont pas destinées à être, et ne constituent pas, des conseils ou recommandations financiers, d'investissement, de trading ou autres fournis ou approuvés par TradingView. Pour en savoir plus, consultez les Conditions d'utilisation.