OPEN-SOURCE SCRIPT
Price Trend Indicator+
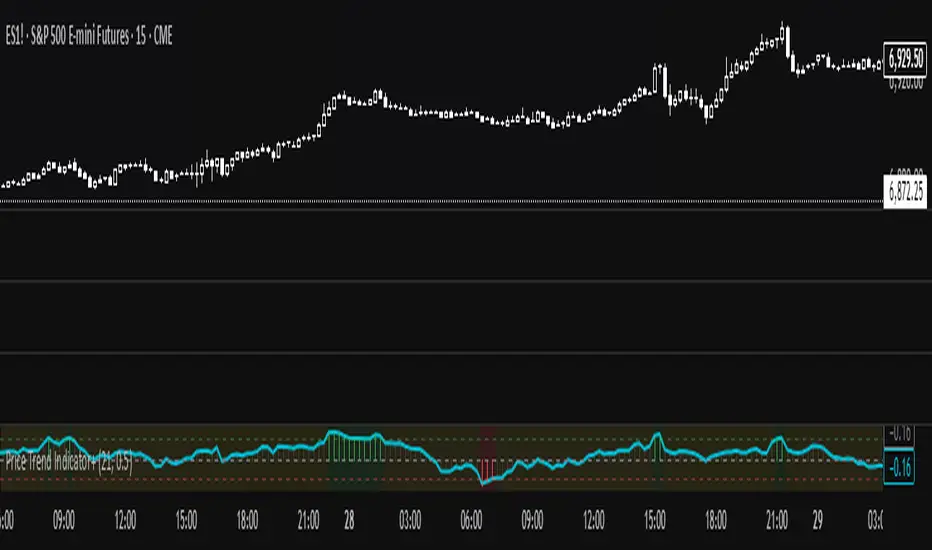
🧠 What it does
It measures the ratio between average price change and average volatility, showing how strong and directional the trend is.
Higher positive values = steady uptrend, negative = downtrend
📊 How to interpret
P value Signal Meaning
P > +0.5 🟢 Strong Uptrend Steady upward movement
0 < P < +0.5 🟡 Mild Uptrend Weak upward bias
P ≈ 0 ⚪ Sideways No clear direction
-0.5 < P < 0 🟠 Mild Downtrend Slight downward bias
P < -0.5 🔴 Strong Downtrend Consistent decline
Script open-source
Dans l'esprit TradingView, le créateur de ce script l'a rendu open source afin que les traders puissent examiner et vérifier ses fonctionnalités. Bravo à l'auteur! Bien que vous puissiez l'utiliser gratuitement, n'oubliez pas que la republication du code est soumise à nos Règles.
Clause de non-responsabilité
Les informations et publications ne sont pas destinées à être, et ne constituent pas, des conseils ou recommandations financiers, d'investissement, de trading ou autres fournis ou approuvés par TradingView. Pour en savoir plus, consultez les Conditions d'utilisation.