PROTECTED SOURCE SCRIPT
WaveViewer
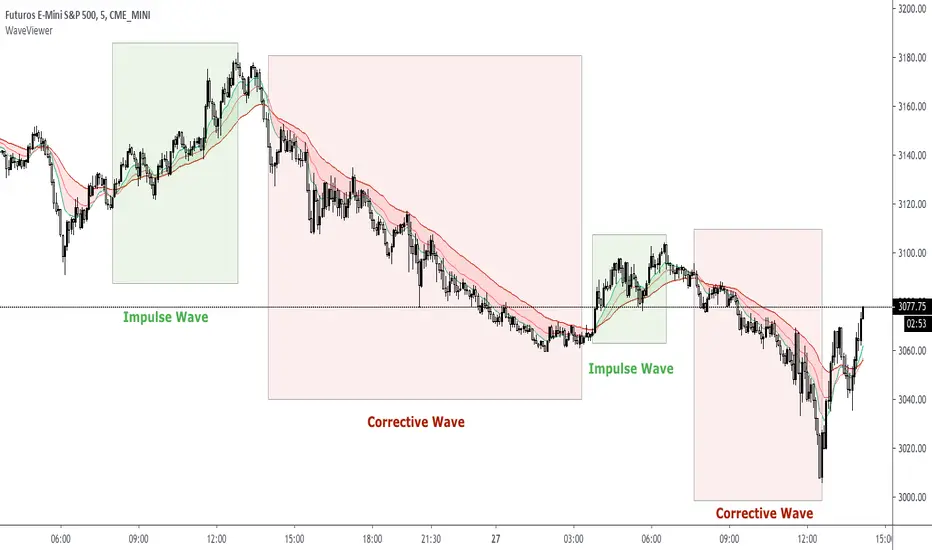
WaveViewer impulsive and corrective wave viewer indicator
The market is developed by making impulsive wave movements and corrective waves thus forming a "V" type fractal
This indicator allows you to easily visualize these movements to make buying or selling decisions
WaveViewer is an indicator that allows the identification of impulsive waves visually through EMAs crossings
Visually facilitates the green color for the impulsive wave and red for the corrective wave
NOTE 1: This indicator should be complemented with the 1-9 fractal counter
NOTE 2: WaveViewer recommended for instrument ES1 ( SP500 ) with timeframe 5 minutes
Script protégé
Ce script est publié en source fermée. Cependant, vous pouvez l'utiliser librement et sans aucune restriction – pour en savoir plus, cliquez ici.
Clause de non-responsabilité
Les informations et publications ne sont pas destinées à être, et ne constituent pas, des conseils ou recommandations financiers, d'investissement, de trading ou autres fournis ou approuvés par TradingView. Pour en savoir plus, consultez les Conditions d'utilisation.