PROTECTED SOURCE SCRIPT
Price Range Deviation
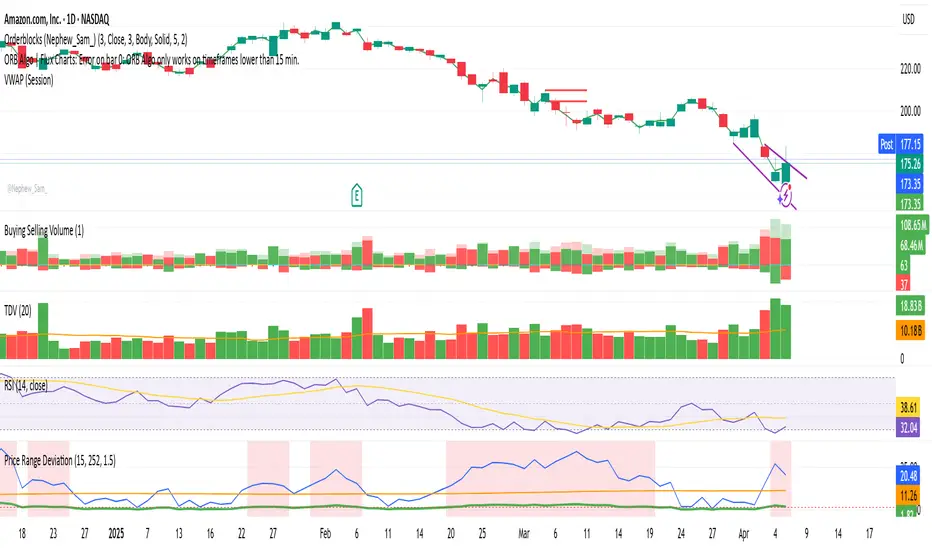
📌 Description: Price Range Deviation Indicator
This indicator measures how much a stock has moved over a recent period (e.g., 15 days) and compares that move to the average move of similar-length windows over a longer lookback period (e.g., 1 year or 252 days).
It helps identify when a stock has made an unusually large move compared to its historical norm — which can signal that the move is overextended.
📊 How It Works:
Recent Move ($): The absolute price change over the selected recent period.
Average Move ($): The average absolute price change over rolling windows of the same size across the full lookback period.
Move Ratio: The current move divided by the average move.
When the move ratio exceeds a custom threshold (e.g., 1.5× the average), the background highlights red to signal that the move is unusually large.
💡 Use Case:
Ideal for options traders looking to:
Identify overextended price moves
Sell out-of-the-money calls or puts beyond a high-move zone
Fade price exhaustion with high probability setups
Script protégé
Ce script est publié en source fermée. Cependant, vous pouvez l'utiliser librement et sans aucune restriction – pour en savoir plus, cliquez ici.
Clause de non-responsabilité
Les informations et publications ne sont pas destinées à être, et ne constituent pas, des conseils ou recommandations financiers, d'investissement, de trading ou autres fournis ou approuvés par TradingView. Pour en savoir plus, consultez les Conditions d'utilisation.