OPEN-SOURCE SCRIPT
adx efi 50 ema channel, trend pullback
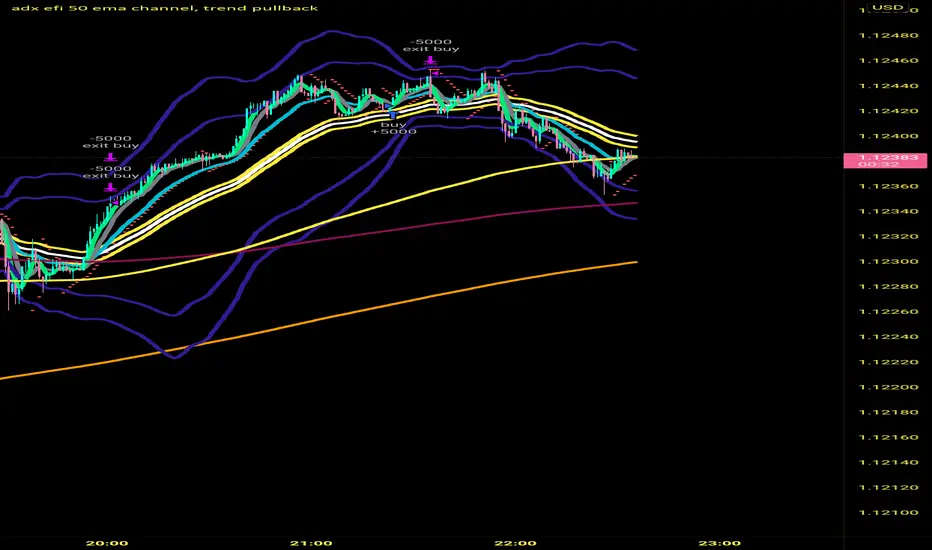
Hi so this strategy is based off 50 ema channel and the 15 ma crossing it to generate signals. But with my adjusted strategy it's a 10 rma crossing 50 ema channels and a 5 and 9 wma to help see pullbacks. 50 period bollinger bands to gage volatility a0nd help during range markets. The strategy signals are generated when longer period efi is above 0 and shorter period efi is below zero and price has pulled back near 50 ema to buy long. And the reverse for shorts, I made this to help me trade more mechanically and to trade 1 minute time frame, that's where the strategy seems to Excell the most, I developed it on eur usd but a brief check seems like it still is profitable on gbp usd aud usd usd jpy I only trade the forex market so not sure about stocks and crypto. If you get signals I would place buy stops and sell stops above high and low of respective signal candle and let price take you into trade. Also adx 20 has to be greater than 20 to take trades. Let me know if this is helpful. I've only been coding for a month so it might look sloppy the way it's coded also there are a few other buy and sell conditions left in the source code if you want to switch between different buy and sell triggers, they all produce good results on 1 min timeframe
Script open-source
Dans l'esprit TradingView, le créateur de ce script l'a rendu open source afin que les traders puissent examiner et vérifier ses fonctionnalités. Bravo à l'auteur! Bien que vous puissiez l'utiliser gratuitement, n'oubliez pas que la republication du code est soumise à nos Règles.
Clause de non-responsabilité
Les informations et publications ne sont pas destinées à être, et ne constituent pas, des conseils ou recommandations financiers, d'investissement, de trading ou autres fournis ou approuvés par TradingView. Pour en savoir plus, consultez les Conditions d'utilisation.