OPEN-SOURCE SCRIPT
Mis à jour All-In-One Sessions, Weekly, Monday, Previous Highs/Lows

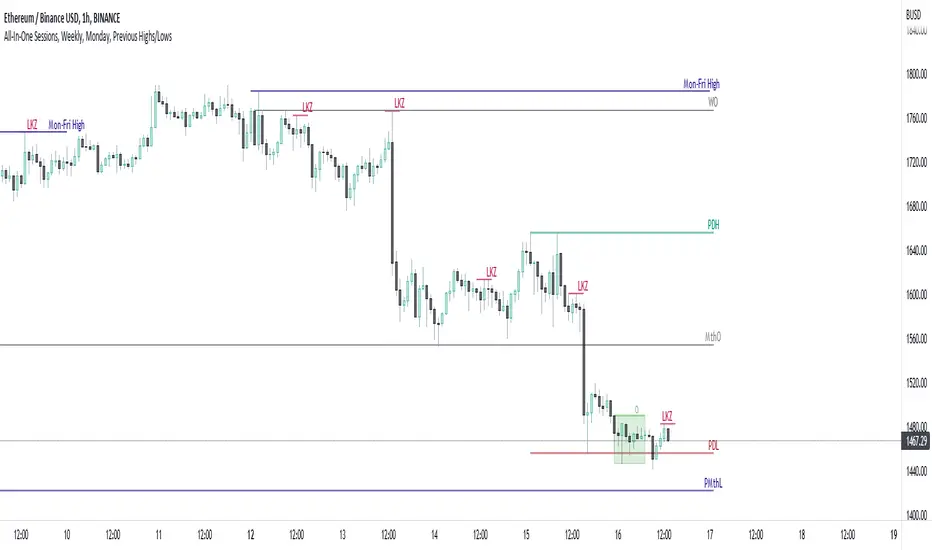
We are forever drawing key levels on our charts with saved drawing templates, but finding the levels, adding the labels, is all tedious stuff. We have indicators, but we have multiple different ones at a time.
What if you could just tick a box on/off?
Well now you can.
This all in one 'levels' indicator is designed to show all the key highs and lows from previous weeks, Monday, the current week, as well as an option to highlight the market sessions and their highs and lows.
There are lots of options available for extending lines and choosing their colors, so once you have set it up how you want, don't forget to save YOUR defaults.
Oorah.
Notes de version
Added the option to abbreviate line labels, defaulting to on.Notes de version
-Notes de version
Added lots of new levels!- Month and Previous Month Highs/Lows
- Weekly and Monthly Opens
- Session Opens (can be shown separate from session boxes)
Also changed the layout of the settings menu, reduced clutter and removed some unecessary options.
Fixed a minor bug with the previous day label tickbox.
Notes de version
EPIC new update.Introducing custom levels.
You can now set up your own custom levels and timeframes.
Choose the session start and end time, choose the level high, low, or open, create a label, choose the days to include.
The flexibility of the new custom levels covers all your needs, create anything from killzones, to Mon - Fri highs/lows, to mid-week open.
Notes de version
Added 3 more custom levelsNotes de version
Increased max bars back from 500 to 5000, necessary for viewing custom levels on lowest time frames like m1.Notes de version
Fixed an issue with historical session boxes not drawing or deleting correctly on higher time frames.Notes de version
Increased look back length to prevent problems on very low timeframesNotes de version
Added some new features for the Monday, Weekly, Monthly levels:- custom label sizes
- label and line offsets, to tidy up overlaps
- 50% level of the high low range
Notes de version
Finally! A very much requested and overdue feature has been added to the indicator. Alerts.Create alerts for all of the daily, weekly, monthly pre-defined levels.
Notes de version
Minor fix to some of the daily levels which were repeated or not displayed correct on a Sunday.Notes de version
Added custom line styles - dotted, dashed and solid, to all the possible lines and levelsNotes de version
Added some new alerts, which will cover groups of levels, reducing the need for so many alerts, but still allowing flexibility.Script open-source
Dans l'esprit TradingView, le créateur de ce script l'a rendu open source afin que les traders puissent examiner et vérifier ses fonctionnalités. Bravo à l'auteur! Bien que vous puissiez l'utiliser gratuitement, n'oubliez pas que la republication du code est soumise à nos Règles.
Clause de non-responsabilité
Les informations et publications ne sont pas destinées à être, et ne constituent pas, des conseils ou recommandations financiers, d'investissement, de trading ou autres fournis ou approuvés par TradingView. Pour en savoir plus, consultez les Conditions d'utilisation.
Script open-source
Dans l'esprit TradingView, le créateur de ce script l'a rendu open source afin que les traders puissent examiner et vérifier ses fonctionnalités. Bravo à l'auteur! Bien que vous puissiez l'utiliser gratuitement, n'oubliez pas que la republication du code est soumise à nos Règles.
Clause de non-responsabilité
Les informations et publications ne sont pas destinées à être, et ne constituent pas, des conseils ou recommandations financiers, d'investissement, de trading ou autres fournis ou approuvés par TradingView. Pour en savoir plus, consultez les Conditions d'utilisation.