OPEN-SOURCE SCRIPT
Mis à jour United HUN City
Purpose and Usage
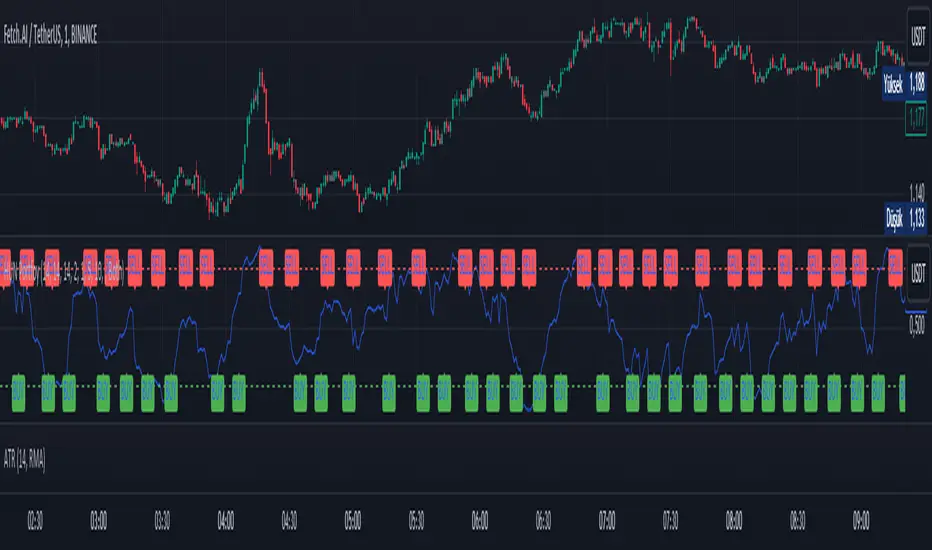
The purpose of this strategy is to create a composite indicator that combines the signals from the MFI, Fisher Transform, and Bollinger Bands %b indicators. By normalizing and averaging these indicators, the script aims to provide a smoother and more comprehensive signal that can be used to make trading decisions.
MFI (Money Flow Index): Measures buying and selling pressure based on price and volume.
Fisher Transform: Highlights potential reversal points by transforming price data to a Gaussian normal distribution.
Bollinger Bands %b: Indicates where the price is relative to the Bollinger Bands, helping to identify overbought or oversold conditions.
The combined indicator can be used to identify potential buy or sell signals based on the smoothed composite value. For instance, a high combined indicator value might indicate overbought conditions, while a low value might indicate oversold conditions.
Notes de version
Purpose and UsageThe purpose of this strategy is to create a composite indicator that combines the signals from the MFI, Fisher Transform, and Bollinger Bands %b indicators. By normalizing and averaging these indicators, the script aims to provide a smoother and more comprehensive signal that can be used to make trading decisions.
MFI (Money Flow Index): Measures buying and selling pressure based on price and volume.
Fisher Transform: Highlights potential reversal points by transforming price data to a Gaussian normal distribution.
Bollinger Bands %b: Indicates where the price is relative to the Bollinger Bands, helping to identify overbought or oversold conditions.
The combined indicator can be used to identify potential buy or sell signals based on the smoothed composite value. For instance, a high combined indicator value might indicate overbought conditions, while a low value might indicate oversold conditions.
2 saat önce
Sürüm Notları:
Purpose and Usage
The purpose of this strategy is to create a composite indicator that combines the signals from the MFI, Fisher Transform, and Bollinger Bands %b indicators. By normalizing and averaging these indicators, the script aims to provide a smoother and more comprehensive signal that can be used to make trading decisions.
MFI (Money Flow Index): Measures buying and selling pressure based on price and volume.
Fisher Transform: Highlights potential reversal points by transforming price data to a Gaussian normal distribution.
Bollinger Bands %b: Indicates where the price is relative to the Bollinger Bands, helping to identify overbought or oversold conditions.
The combined indicator can be used to identify potential buy or sell signals based on the smoothed composite value. For instance, a high combined indicator value might indicate overbought conditions, while a low value might indicate oversold conditions.
v2 Notes:
-Buy and Sell Signals Added:
Buy and sell signals are now integrated into the script.
-Band Levels Added:
Horizontal reference lines (bands) at specific levels are included.
-Minimum Number of Bars Between Buy and Sell Signals Added:
A user-defined input for the minimum number of bars between buy and sell signals is implemented.
-HUN Portfoy Percentage Change Added:
The percentage change calculation for the HUN Portfoy combined indicator is included.
Notes de version
Added timeframe change on the chart.Notes de version
V3 UpdatesNotes de version
v3.1Script open-source
Dans l'esprit TradingView, le créateur de ce script l'a rendu open source afin que les traders puissent examiner et vérifier ses fonctionnalités. Bravo à l'auteur! Bien que vous puissiez l'utiliser gratuitement, n'oubliez pas que la republication du code est soumise à nos Règles.
Clause de non-responsabilité
Les informations et publications ne sont pas destinées à être, et ne constituent pas, des conseils ou recommandations financiers, d'investissement, de trading ou autres fournis ou approuvés par TradingView. Pour en savoir plus, consultez les Conditions d'utilisation.
Script open-source
Dans l'esprit TradingView, le créateur de ce script l'a rendu open source afin que les traders puissent examiner et vérifier ses fonctionnalités. Bravo à l'auteur! Bien que vous puissiez l'utiliser gratuitement, n'oubliez pas que la republication du code est soumise à nos Règles.
Clause de non-responsabilité
Les informations et publications ne sont pas destinées à être, et ne constituent pas, des conseils ou recommandations financiers, d'investissement, de trading ou autres fournis ou approuvés par TradingView. Pour en savoir plus, consultez les Conditions d'utilisation.