OPEN-SOURCE SCRIPT
MACD with SAR Indicator [CHE]
MACD with SAR Indicator
Introduction
"The whole is greater than the sum of its parts." The "MACD with SAR Indicator" is an innovative technical analysis tool that combines the strengths of the Moving Average Convergence Divergence (MACD) indicator with the Parabolic Stop and Reverse (SAR) indicator. This indicator provides traders with an enhanced method to detect trend changes and determine optimal entry and exit points in the market by using the SAR based on the MACD line to better identify reversal points. The combination generates clear trend reversal signals, which are visually represented through long (L) and short (S) signals on the chart.
Originality and Usefulness
This indicator differs from traditional MACD or SAR indicators by combining the trend-following calculations of the SAR with the trend strength and momentum calculations of the MACD. This enables a more precise identification of trend changes and provides clear buy and sell signals, which is particularly useful for manual traders.
Key Features and Functionality
1. Combination of MACD and SAR
- Why this Combination?: The MACD is known for its ability to measure the strength and direction of a trend, while the SAR is specifically designed to identify reversal points. By combining these two indicators, traders can better understand both the trend strength and potential turning points in the market.
- How Components Work Together: The MACD measures the difference between fast and slow moving averages, indicating market momentum. The SAR follows the MACD line instead of the price and marks potential reversal points more accurately. When the MACD signals a new trend and the SAR confirms it, the indicator provides reliable trading opportunities.
2. Adjustable Parameters
- MACD Settings: Users can adjust the lengths of the fast and slow moving averages (default: 28 and 38 periods) and the signal smoothing (default: 9 periods) to tailor the indicator to different market conditions.
- SAR Settings: Users can adjust the start value (default: 0.01), increment (default: 0.01), and maximum value (default: 0.18) of the SAR to control sensitivity and responsiveness.
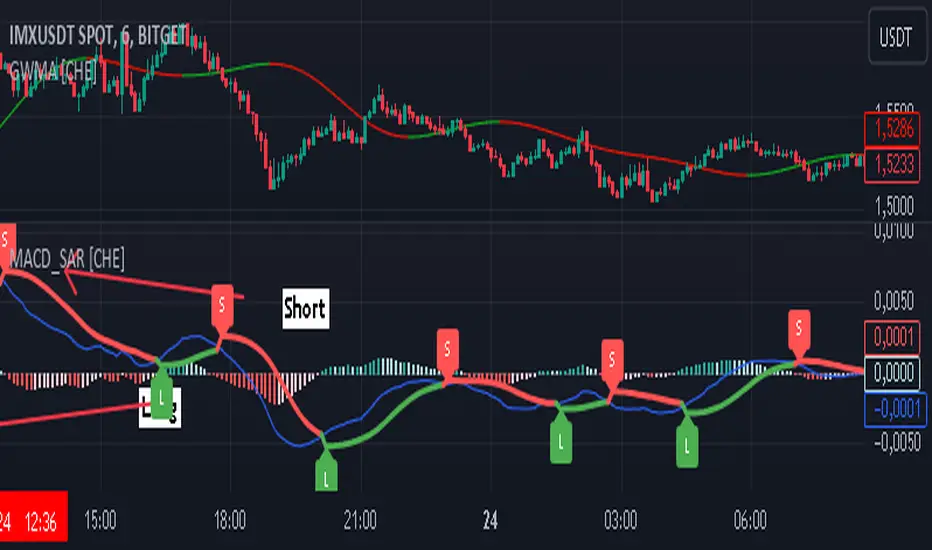
3. Visual Representation and Signals
- Color-Coded Histograms: The histogram shows the difference between the MACD and signal line and is color-coded to highlight the direction of the trend.
- Signal Labels: The indicator automatically adds "L" (Long) and "S" (Short) labels on the chart to show the current positions to traders.
4. Alert Settings
- Custom Alerts: Alerts can be set to notify traders when the MACD and SAR experience significant state changes, such as when the histogram switches from rising to falling or vice versa.
5. Toggle Display
- Display Mode: Users can toggle the display of the MACD_SAR oscillator and MACD to focus on the information most relevant to their trading strategy.
Application and Benefits
- Versatility: This indicator can be used in various market conditions and for different trading strategies, including trend following and reversal trading.
- Ease of Interpretation: The clear visual representation and automatic signals make it easier for traders to identify trading opportunities and track trends.
- Customizability: With numerous settings options, the indicator can be tailored to individual preferences and specific market conditions.
Conclusion
The "MACD with SAR Indicator" is a valuable tool for traders seeking precise and reliable signals to identify market trends and make profitable trading decisions. With its extensive customization options, powerful features, and the ability to toggle displays, this indicator provides excellent support for technical analysis.
By emphasizing the synergy between the MACD and SAR indicators, highlighting the default settings, and clarifying that the SAR is based on the MACD line and generates clear trend reversal signals through long and short labels, this revised description should help users understand the functionalities and advantages of your indicator while meeting TradingView's publication requirements.
Best regards Chervolino
Introduction
"The whole is greater than the sum of its parts." The "MACD with SAR Indicator" is an innovative technical analysis tool that combines the strengths of the Moving Average Convergence Divergence (MACD) indicator with the Parabolic Stop and Reverse (SAR) indicator. This indicator provides traders with an enhanced method to detect trend changes and determine optimal entry and exit points in the market by using the SAR based on the MACD line to better identify reversal points. The combination generates clear trend reversal signals, which are visually represented through long (L) and short (S) signals on the chart.
Originality and Usefulness
This indicator differs from traditional MACD or SAR indicators by combining the trend-following calculations of the SAR with the trend strength and momentum calculations of the MACD. This enables a more precise identification of trend changes and provides clear buy and sell signals, which is particularly useful for manual traders.
Key Features and Functionality
1. Combination of MACD and SAR
- Why this Combination?: The MACD is known for its ability to measure the strength and direction of a trend, while the SAR is specifically designed to identify reversal points. By combining these two indicators, traders can better understand both the trend strength and potential turning points in the market.
- How Components Work Together: The MACD measures the difference between fast and slow moving averages, indicating market momentum. The SAR follows the MACD line instead of the price and marks potential reversal points more accurately. When the MACD signals a new trend and the SAR confirms it, the indicator provides reliable trading opportunities.
2. Adjustable Parameters
- MACD Settings: Users can adjust the lengths of the fast and slow moving averages (default: 28 and 38 periods) and the signal smoothing (default: 9 periods) to tailor the indicator to different market conditions.
- SAR Settings: Users can adjust the start value (default: 0.01), increment (default: 0.01), and maximum value (default: 0.18) of the SAR to control sensitivity and responsiveness.
3. Visual Representation and Signals
- Color-Coded Histograms: The histogram shows the difference between the MACD and signal line and is color-coded to highlight the direction of the trend.
- Signal Labels: The indicator automatically adds "L" (Long) and "S" (Short) labels on the chart to show the current positions to traders.
4. Alert Settings
- Custom Alerts: Alerts can be set to notify traders when the MACD and SAR experience significant state changes, such as when the histogram switches from rising to falling or vice versa.
5. Toggle Display
- Display Mode: Users can toggle the display of the MACD_SAR oscillator and MACD to focus on the information most relevant to their trading strategy.
Application and Benefits
- Versatility: This indicator can be used in various market conditions and for different trading strategies, including trend following and reversal trading.
- Ease of Interpretation: The clear visual representation and automatic signals make it easier for traders to identify trading opportunities and track trends.
- Customizability: With numerous settings options, the indicator can be tailored to individual preferences and specific market conditions.
Conclusion
The "MACD with SAR Indicator" is a valuable tool for traders seeking precise and reliable signals to identify market trends and make profitable trading decisions. With its extensive customization options, powerful features, and the ability to toggle displays, this indicator provides excellent support for technical analysis.
By emphasizing the synergy between the MACD and SAR indicators, highlighting the default settings, and clarifying that the SAR is based on the MACD line and generates clear trend reversal signals through long and short labels, this revised description should help users understand the functionalities and advantages of your indicator while meeting TradingView's publication requirements.
Best regards Chervolino
Script open-source
Dans l'esprit TradingView, le créateur de ce script l'a rendu open source afin que les traders puissent examiner et vérifier ses fonctionnalités. Bravo à l'auteur! Bien que vous puissiez l'utiliser gratuitement, n'oubliez pas que la republication du code est soumise à nos Règles.
Clause de non-responsabilité
Les informations et publications ne sont pas destinées à être, et ne constituent pas, des conseils ou recommandations financiers, d'investissement, de trading ou autres fournis ou approuvés par TradingView. Pour en savoir plus, consultez les Conditions d'utilisation.