Summit Line
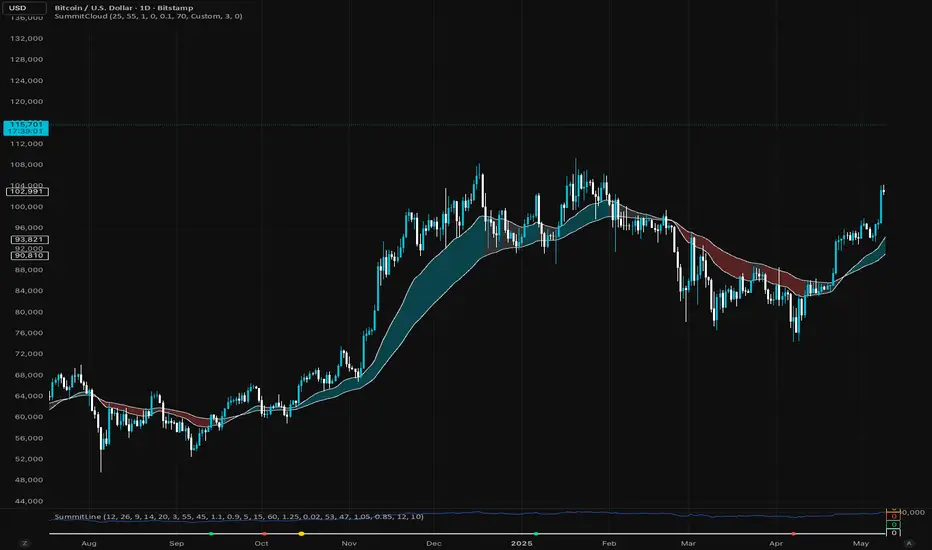
It blends MACD, RSI, moving averages and Volume Strength, giving traders a real time gauge of momentum shifts and exhaustion points.
🟢 Green Dot: Bullish confluence
🔴 Red Dot: Bearish confluence
🟡 Gold Dot: “A+” setup, rare alignment of all core metrics, typically at high-probability reversal or breakout zones.
Unlike noisy indicators, Summit Line filters weak signals using RSI slope, volume surges, and EMA trend structure, keeping the chart clean and accurate.
Every dot is pinned along a flat zero baseline for visual simplicity, ideal for combining with the Summit cloud or other price overlays.
Script sur invitation seulement
Seuls les utilisateurs approuvés par l'auteur peuvent accéder à ce script. Vous devrez demander et obtenir l'autorisation pour l'utiliser. Celle-ci est généralement accordée après paiement. Pour plus de détails, suivez les instructions de l'auteur ci-dessous ou contactez directement jedhucker.
TradingView ne recommande PAS d'acheter ou d'utiliser un script à moins que vous ne fassiez entièrement confiance à son auteur et que vous compreniez son fonctionnement. Vous pouvez également trouver des alternatives gratuites et open source dans nos scripts communautaires.
Instructions de l'auteur
Clause de non-responsabilité
Script sur invitation seulement
Seuls les utilisateurs approuvés par l'auteur peuvent accéder à ce script. Vous devrez demander et obtenir l'autorisation pour l'utiliser. Celle-ci est généralement accordée après paiement. Pour plus de détails, suivez les instructions de l'auteur ci-dessous ou contactez directement jedhucker.
TradingView ne recommande PAS d'acheter ou d'utiliser un script à moins que vous ne fassiez entièrement confiance à son auteur et que vous compreniez son fonctionnement. Vous pouvez également trouver des alternatives gratuites et open source dans nos scripts communautaires.