OPEN-SOURCE SCRIPT
Mis à jour Pearson Correlation [Mr_Rakun]
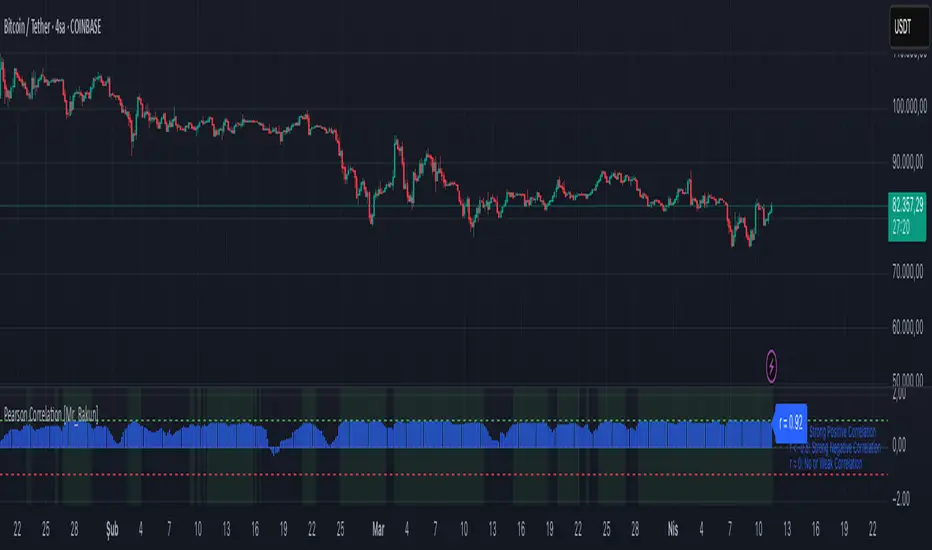
Pearson Correlation
This script calculates the Pearson correlation coefficient (r) between the closing price of the current asset and another selected asset.
🔍 How It Works:
• The user selects a correlation period (default: 20) and a symbol (default: ETH/USDT).
• The script retrieves the closing prices of both assets.
• The Pearson correlation formula is applied:
r = \frac{n(\sum xy) - (\sum x)(\sum y)}{\sqrt{[n\sum x^2 - (\sum x)^2][n\sum y^2 - (\sum y)^2]}}
• The correlation is plotted as a histogram:
• +1 (green line) → Perfect positive correlation
• -1 (red line) → Perfect negative correlation
• 0 (gray line) → No correlation
📊 Why Use This?
This indicator helps traders identify relationships between assets, such as whether two markets move together or inversely. It is useful for hedging strategies, portfolio diversification, and market comparisons.
Notes de version
- InfoScript open-source
Dans l'esprit TradingView, le créateur de ce script l'a rendu open source afin que les traders puissent examiner et vérifier ses fonctionnalités. Bravo à l'auteur! Bien que vous puissiez l'utiliser gratuitement, n'oubliez pas que la republication du code est soumise à nos Règles.
Clause de non-responsabilité
Les informations et publications ne sont pas destinées à être, et ne constituent pas, des conseils ou recommandations financiers, d'investissement, de trading ou autres fournis ou approuvés par TradingView. Pour en savoir plus, consultez les Conditions d'utilisation.
Script open-source
Dans l'esprit TradingView, le créateur de ce script l'a rendu open source afin que les traders puissent examiner et vérifier ses fonctionnalités. Bravo à l'auteur! Bien que vous puissiez l'utiliser gratuitement, n'oubliez pas que la republication du code est soumise à nos Règles.
Clause de non-responsabilité
Les informations et publications ne sont pas destinées à être, et ne constituent pas, des conseils ou recommandations financiers, d'investissement, de trading ou autres fournis ou approuvés par TradingView. Pour en savoir plus, consultez les Conditions d'utilisation.