OPEN-SOURCE SCRIPT
ET's Flags
Purpose:
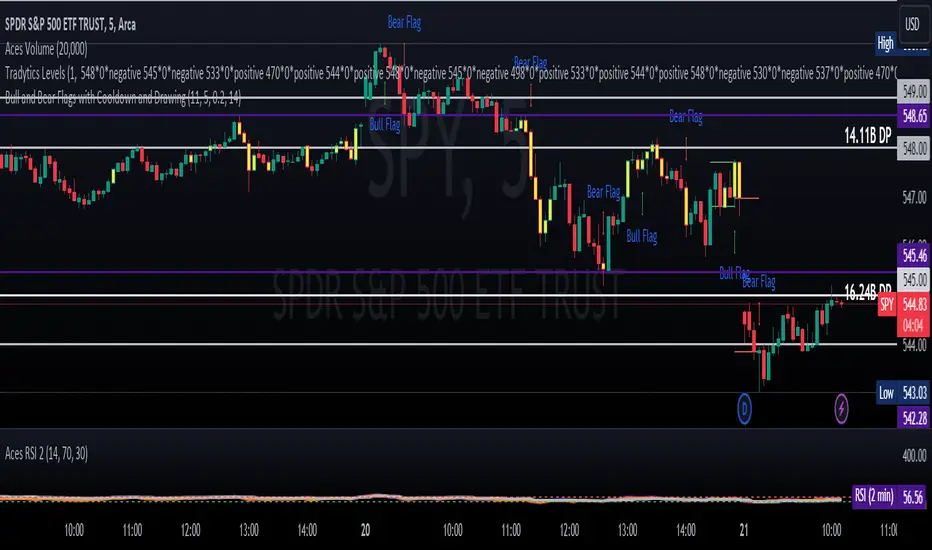
This Pine Script is designed for the TradingView platform to identify and visually highlight specific technical chart patterns known as "Bull Flags" and "Bear Flags" on financial charts. These patterns are significant in trading as they can indicate potential continuation trends after a brief consolidation. The script includes mechanisms to manage signal frequency through a cooldown period, ensuring that the trading signals are not excessively frequent and are easier to interpret.
Functionality:
Input Parameters:
flagpole_length: Defines the number of bars to consider when identifying the initial surge in price, known as the flagpole.
flag_length: Determines the number of bars over which the flag itself is identified, representing a period of consolidation.
percent_change: Sets the minimum percentage change required to validate the presence of a flagpole.
cooldown_period: Specifies the number of bars to wait before another flag can be identified, reducing the risk of overlapping signals.
Percentage Change Calculation:
The script calculates the percentage change between two price points using a helper function percentChange(start, end). This function is crucial for determining whether the price movement within the specified flagpole_length meets the threshold set by percent_change, thus qualifying as a potential flagpole.
Flagpole Identification:
Bull Flagpole: Identified by finding the lowest close price over the flagpole_length and determining if the subsequent price rise meets or exceeds the specified percent_change.
Bear Flagpole: Identified by finding the highest close price over the flagpole_length and checking if the subsequent price drop is sufficient as per the percent_change.
Flag Identification:
After identifying a flagpole, the script assesses if the price action within the next flag_length bars consolidates in a manner that fits a flag pattern. This involves checking if the price fluctuation stays within the bounds set by the percent_change.
Signal Plotting:
If a bull or bear flag pattern is confirmed, and the cooldown period has passed since the last flag of the same type was identified, the script plots a visual shape on the chart:
Green shapes below the price bar for Bull Flags.
Red shapes above the price bar for Bear Flags.
Line Drawing:
For enhanced visualization, the script draws lines at the high and low prices of the flag during its formation period. This visually represents the consolidation phase of the flag pattern.
Debugging Labels:
The script optionally displays labels at the flag formation points, showing the exact percentage change achieved during the flagpole formation. This feature aids users in understanding why a particular segment of the price chart was identified as a flag.
Compliance and Usage:
This script does not automate trading but provides visual aids and potential signals based on historical price analysis. It adheres to TradingView's scripting policies by only accessing publicly available price data and user-defined parameters without executing trades or accessing any external data.
Conclusion:
This Pine Script is a powerful tool for traders who follow technical analysis, offering a clear, automated way to spot potential continuation patterns in the markets they monitor. By emphasizing visual clarity and reducing signal redundancy through cooldown periods, the script enhances decision-making processes for chart analysis on TradingView.
Script open-source
Dans l'esprit TradingView, le créateur de ce script l'a rendu open source afin que les traders puissent examiner et vérifier ses fonctionnalités. Bravo à l'auteur! Bien que vous puissiez l'utiliser gratuitement, n'oubliez pas que la republication du code est soumise à nos Règles.
Clause de non-responsabilité
Les informations et publications ne sont pas destinées à être, et ne constituent pas, des conseils ou recommandations financiers, d'investissement, de trading ou autres fournis ou approuvés par TradingView. Pour en savoir plus, consultez les Conditions d'utilisation.