OPEN-SOURCE SCRIPT
Mis à jour Normalized Dist from 4H MA200 + Chart Highlights
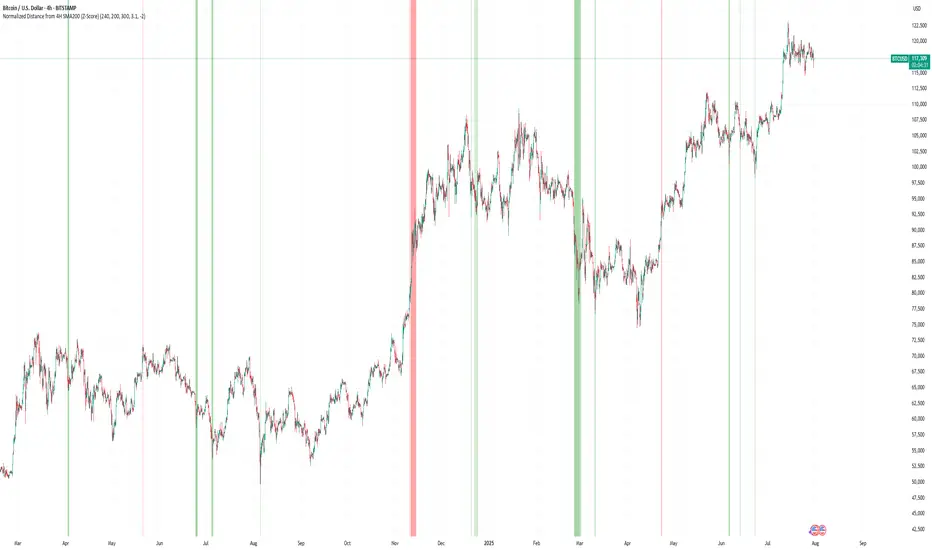
Normalized Distance from 4H EMA200 + Highlighting Extremes
This indicator measures the distance between the current price and the 4-hour EMA200, normalized into a z-score to detect statistically significant deviations.
🔹 The lower pane shows the normalized z-score.
🔹 Green background = price far below EMA200 (z < -2).
🔹 Red background = price far above EMA200 (z > 3.1).
🔹 These thresholds are user-configurable.
🔹 On the main chart:
🟥 Red candles indicate overheated prices (z > upper threshold)
🟩 Green candles signal oversold conditions (z < lower threshold)
The EMA200 is always taken from a fixed 4H timeframe, regardless of your current chart resolution.
Notes de version
Normalized Distance from 4H EMA200 + Highlighting ExtremesThis indicator measures the distance between the current price and the 4-hour EMA200, normalized into a z-score to detect statistically significant deviations.
🔹 The lower pane shows the normalized z-score.
🔹 Green background = price far below EMA200 (z < -2).
🔹 Red background = price far above EMA200 (z > 3.1).
🔹 These thresholds are user-configurable.
🔹 On the main chart:
🟥 Red candles indicate overheated prices (z > upper threshold)
🟩 Green candles signal oversold conditions (z < lower threshold)
The EMA200 is always taken from a fixed 4H timeframe, regardless of your current chart resolution.
Script open-source
Dans l'esprit TradingView, le créateur de ce script l'a rendu open source afin que les traders puissent examiner et vérifier ses fonctionnalités. Bravo à l'auteur! Bien que vous puissiez l'utiliser gratuitement, n'oubliez pas que la republication du code est soumise à nos Règles.
Clause de non-responsabilité
Les informations et publications ne sont pas destinées à être, et ne constituent pas, des conseils ou recommandations financiers, d'investissement, de trading ou autres fournis ou approuvés par TradingView. Pour en savoir plus, consultez les Conditions d'utilisation.