PROTECTED SOURCE SCRIPT
Mis à jour Nifty SentiMeter
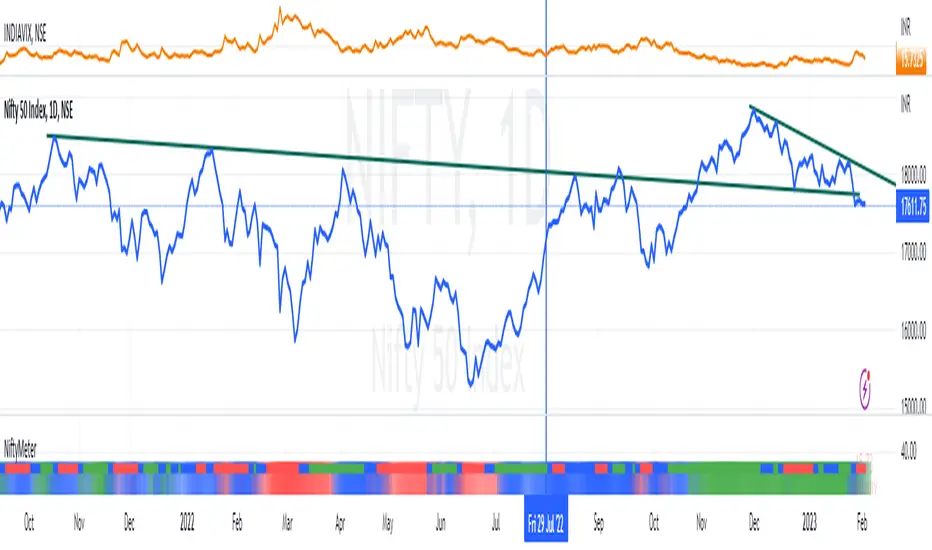
This meter displays a colour code based sentiment for the Nifty50 Index.
In order to do so, it uses the IndiaVix, that is the standard for determining the broader market Investor sentiment. The IndiaVix and the Nifty50 are inversely correlated. A spiking Vix on the upside indicates panic and fear in the market, that is reflected in price of the Nifty50, usually accompanied by steep falls. On the other hand, a stabilised and low volatile Vix, creates an atmosphere conducive for positive investor activity.
This indicator, uses this concept of inverse correlation between the Vix and the Benchmark, to plot the changes of investor sentiments over a period of time and the current sentiment.
This indicator should be used only on the DAILY timeframe for best results.
The best way to analyse the NiftyMeter is to observe the colour changes, that will help in understanding the changing investor sentiments.
A quick guide is as follows:
In general, Red indicates fear, Blue indicates a transitioning phase of sentiment (bull to bear or bear to bull), Green indicates bullish sentiment.
A stronger shade of the colour will indicate a stronger sentiment.
In order to do so, it uses the IndiaVix, that is the standard for determining the broader market Investor sentiment. The IndiaVix and the Nifty50 are inversely correlated. A spiking Vix on the upside indicates panic and fear in the market, that is reflected in price of the Nifty50, usually accompanied by steep falls. On the other hand, a stabilised and low volatile Vix, creates an atmosphere conducive for positive investor activity.
This indicator, uses this concept of inverse correlation between the Vix and the Benchmark, to plot the changes of investor sentiments over a period of time and the current sentiment.
This indicator should be used only on the DAILY timeframe for best results.
The best way to analyse the NiftyMeter is to observe the colour changes, that will help in understanding the changing investor sentiments.
A quick guide is as follows:
- Blue to Red, Green to Red - Indicates the positive investor sentiment has turned into bear - fear.
- Red and getting Stronger Red - Indicates that the fear is sustained.
- Blue to Green, Red to Green - Indicates that positive investor sentiment is back. It is now time for bulls to be active again.
In general, Red indicates fear, Blue indicates a transitioning phase of sentiment (bull to bear or bear to bull), Green indicates bullish sentiment.
A stronger shade of the colour will indicate a stronger sentiment.
Notes de version
- Some clean up
- Added a "Fast" check over the existing "Slow"
Script protégé
Ce script est publié en source fermée. Cependant, vous pouvez l'utiliser librement et sans aucune restriction – pour en savoir plus, cliquez ici.
Clause de non-responsabilité
Les informations et publications ne sont pas destinées à être, et ne constituent pas, des conseils ou recommandations financiers, d'investissement, de trading ou autres fournis ou approuvés par TradingView. Pour en savoir plus, consultez les Conditions d'utilisation.