OPEN-SOURCE SCRIPT
Mis à jour Grover Llorens Cycle Oscillator [alexgrover & Lucía Llorens]
Cycles represent relatively smooth fluctuations with mean 0 and of varying period and amplitude, their estimation using technical indicators has always been a major task. In the additive model of price, the cycle is a component :
Price = Trend + Cycle + Noise
Based on this model we can deduce that :
Cycle = Price - Trend - Noise
The indicators specialized on the estimation of cycles are oscillators, some like bandpass filters aim to return a correct estimate of the cycles, while others might only show a deformation of them, this can be done in order to maximize the visualization of the cycles.
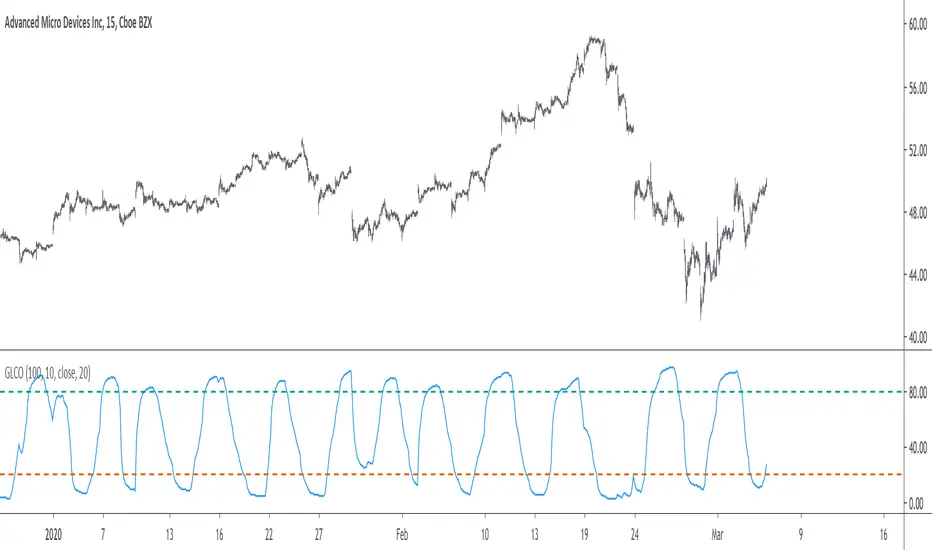
Today an oscillator who aim to maximize the visualization of the cycles is presented, the oscillator is based on the difference between the price and the previously proposed Grover Llorens activator indicator. A relative strength index is then applied to this difference in order to minimize the change of amplitude in the cycles.
![Grover Llorens Activator [alexgrover & Lucía Llorens]](https://s3.tradingview.com/u/UVzC9TOv_mid.png)
The Indicator
The indicator include the length and mult settings used by the Grover Llorens activator. Length control the rate of convergence of the activator, lower values of length will output cycles of a faster period.

here length = 50
Mult is responsible for maximizing the visualization of the cycles, low values of mult will return a less cyclical output.

Here mult = 1
Finally you can smooth the indicator output if you want (smooth by default), you can uncheck the option if you want a noisy output.

The smoothing amount is also linked with the period of the rsi.

Here the smoothing amount = 100.
Conclusion
An oscillator based on the recently posted Grover Llorens activator has been proposed. The oscillator aim to maximize the visualization of cycles.
Maximizing the visualization of cycles don't comes with no cost, the indicator output can be uncorrelated with the actual cycles or can return cycles that are not present in the price. Other problems arises from the indicator settings, because cycles are of a time-varying periods it isn't optimal to use fixed length oscillators for their estimation.
Thanks for reading !
If my work has ever been of use to you you can donate, addresses on my signature :)
Price = Trend + Cycle + Noise
Based on this model we can deduce that :
Cycle = Price - Trend - Noise
The indicators specialized on the estimation of cycles are oscillators, some like bandpass filters aim to return a correct estimate of the cycles, while others might only show a deformation of them, this can be done in order to maximize the visualization of the cycles.
Today an oscillator who aim to maximize the visualization of the cycles is presented, the oscillator is based on the difference between the price and the previously proposed Grover Llorens activator indicator. A relative strength index is then applied to this difference in order to minimize the change of amplitude in the cycles.
The Indicator
The indicator include the length and mult settings used by the Grover Llorens activator. Length control the rate of convergence of the activator, lower values of length will output cycles of a faster period.
here length = 50
Mult is responsible for maximizing the visualization of the cycles, low values of mult will return a less cyclical output.
Here mult = 1
Finally you can smooth the indicator output if you want (smooth by default), you can uncheck the option if you want a noisy output.
The smoothing amount is also linked with the period of the rsi.
Here the smoothing amount = 100.
Conclusion
An oscillator based on the recently posted Grover Llorens activator has been proposed. The oscillator aim to maximize the visualization of cycles.
Maximizing the visualization of cycles don't comes with no cost, the indicator output can be uncorrelated with the actual cycles or can return cycles that are not present in the price. Other problems arises from the indicator settings, because cycles are of a time-varying periods it isn't optimal to use fixed length oscillators for their estimation.
Thanks for reading !
If my work has ever been of use to you you can donate, addresses on my signature :)
Notes de version
Fixed repainting issuesScript open-source
Dans l'esprit TradingView, le créateur de ce script l'a rendu open source afin que les traders puissent examiner et vérifier ses fonctionnalités. Bravo à l'auteur! Bien que vous puissiez l'utiliser gratuitement, n'oubliez pas que la republication du code est soumise à nos Règles.
Check out the indicators we are making at luxalgo: tradingview.com/u/LuxAlgo/
"My heart is so loud that I can't hear the fireworks"
"My heart is so loud that I can't hear the fireworks"
Clause de non-responsabilité
Les informations et publications ne sont pas destinées à être, et ne constituent pas, des conseils ou recommandations financiers, d'investissement, de trading ou autres fournis ou approuvés par TradingView. Pour en savoir plus, consultez les Conditions d'utilisation.
Script open-source
Dans l'esprit TradingView, le créateur de ce script l'a rendu open source afin que les traders puissent examiner et vérifier ses fonctionnalités. Bravo à l'auteur! Bien que vous puissiez l'utiliser gratuitement, n'oubliez pas que la republication du code est soumise à nos Règles.
Check out the indicators we are making at luxalgo: tradingview.com/u/LuxAlgo/
"My heart is so loud that I can't hear the fireworks"
"My heart is so loud that I can't hear the fireworks"
Clause de non-responsabilité
Les informations et publications ne sont pas destinées à être, et ne constituent pas, des conseils ou recommandations financiers, d'investissement, de trading ou autres fournis ou approuvés par TradingView. Pour en savoir plus, consultez les Conditions d'utilisation.