OPEN-SOURCE SCRIPT
Mis à jour Bjorgum RSI

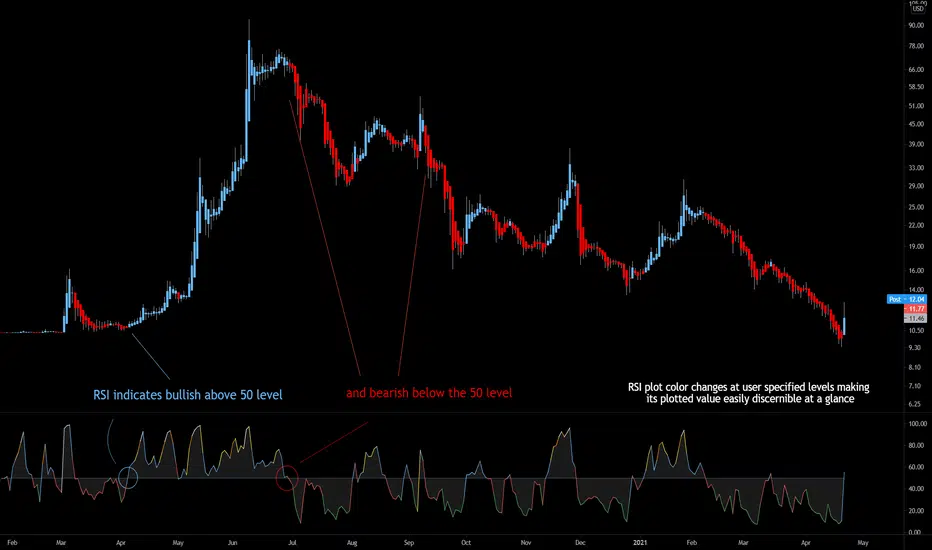
RSI output signals are displayed with color change to reflect the plotted value. This makes evaluating RSI conditions require but a glance.
RSI momentum buy signals are given on the cross of the 50 level, whereas sell signals are given on a fall below.
Default values a 5 period RSI which gives more timely entrances and exits for swing traders. This can be adjusted to the typical 14 period if the viewer desires slower signals.
Bullish and bearish area is shaded to accentuate the signal to the eye.
Excellent results can be found when coupling BJ RSI, with BJ TSI, and the reversal system using all 3 as a complete together simultaneously
Default color changes are plotted as a recorded value falls within the following levels:
RSI < 30 = green
RSI 30-50 = red
RSI 50-70 = blue
RSI 70-80 = yellow
RSI 80-90 = orange
RSI 90-100 = white hot
Notes de version
*ALL NEW* RSI is now fully customizable at each 5 cent increment. Create your own color schemes outside of default to alter the plot color at any RSI level you choose
Notes de version
Dual speed selectorFast (default) uses typical BJ RSI inputs for a 5 period RSI. Best for swing trading - quick signals, more whipsaw
Slow (optional) uses a standard RSI input of 14 periods. Better for longer holds or volatile assets - less whipsaw, later signals
The user can select desired speed by simply selecting the drop down box to vary between user defined input lengths
Added alert function for RSI crossing 50. Alert specifies time period triggered and price at time of alert
Notes de version
Added optional toggle on input screen that will change the bar color to the user defined color values inline with RSI values. *Default is to not show bar color user must opt for the function*
Notes de version
ALL NEW FEATURES- Multi-timeframe options allow for a view of higher time frame momentum
- 2 new color schemes have been added. Heat Map and Tri-color gradients
- Overbought and Oversold lines are now selectable at your desired levels.
- New directional alerts for crosses of the mid line, and the custom OB/OS levels
- Bar color can now be used on the new color schemes
- Code Update to version 5
NEW CUSTOM LOOKS
Script open-source
Dans l'esprit TradingView, le créateur de ce script l'a rendu open source afin que les traders puissent examiner et vérifier ses fonctionnalités. Bravo à l'auteur! Bien que vous puissiez l'utiliser gratuitement, n'oubliez pas que la republication du code est soumise à nos Règles.
Clause de non-responsabilité
Les informations et publications ne sont pas destinées à être, et ne constituent pas, des conseils ou recommandations financiers, d'investissement, de trading ou autres fournis ou approuvés par TradingView. Pour en savoir plus, consultez les Conditions d'utilisation.