PROTECTED SOURCE SCRIPT
Volatility Rank Dashboard
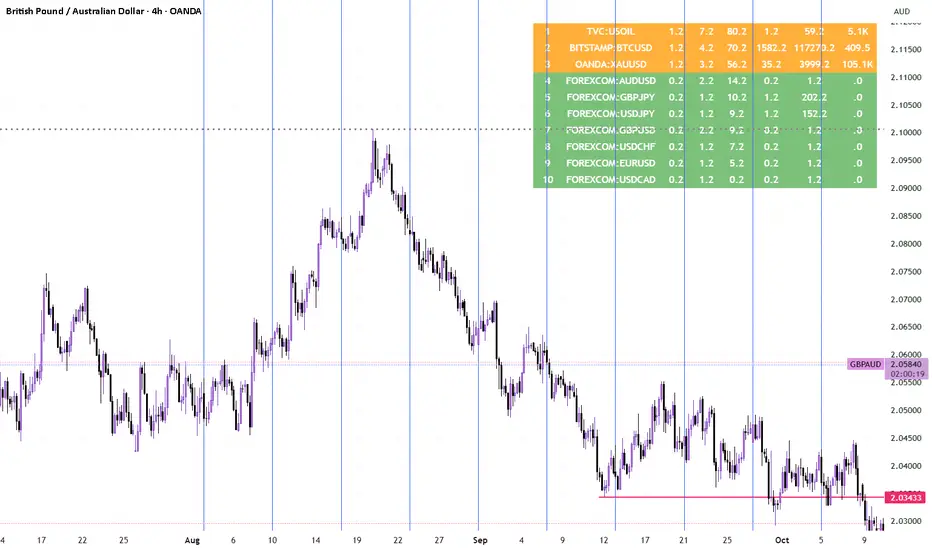
A dynamic multi-symbol dashboard that ranks assets live by their normalized volatility across multiple dimensions.
How it works:
The script scans up to 40 symbols (per TradingView request limits), calculating for each:
ATR% – average true range as a percentage of price (true volatility)
BB Width% – Bollinger Band width as relative spread (market compression/expansion)
Volume or Notional – filters or weights activity by liquidity
A composite volatility score is computed using adjustable weights (ATR%, BB%, Volume).
Symbols are ranked in real time on a color-coded table, highlighting the most volatile and active markets.
Extra features:
Session filter (London, New York, or custom trading hours)
Alerts for ATR% / BB% threshold cross or when a new #1 appears
Automatic 40-request safety management
Adaptive color heat map for instant visual comparison
Use it to quickly identify which assets are moving, liquid, and worth your attention — across any asset class or timeframe.
Script protégé
Ce script est publié en source fermée. Toutefois, vous pouvez l'utiliser librement et sans aucune restriction - en savoir plus ici.
Clause de non-responsabilité
Les informations et les publications ne sont pas destinées à être, et ne constituent pas, des conseils ou des recommandations en matière de finance, d'investissement, de trading ou d'autres types de conseils fournis ou approuvés par TradingView. Pour en savoir plus, consultez les Conditions d'utilisation.