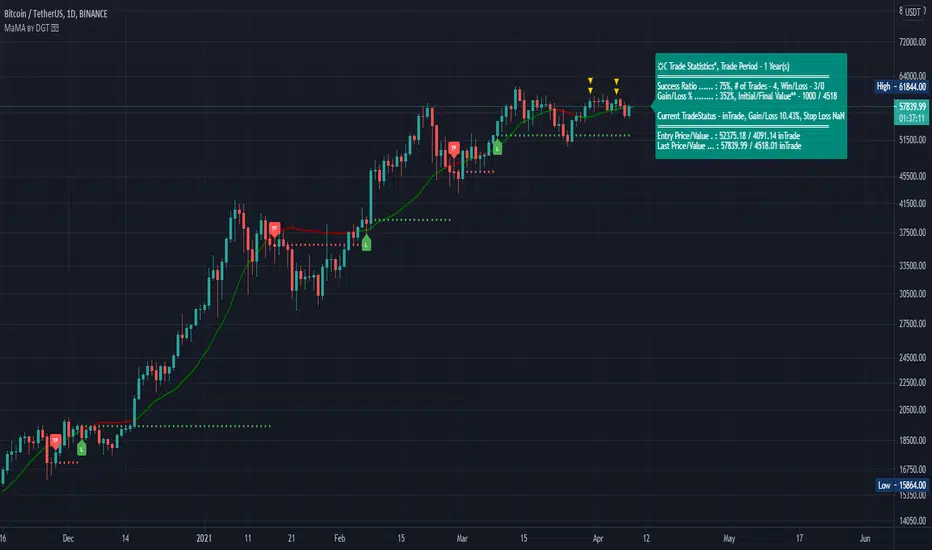
Momentum adjusted Moving Average by DGTA brand new Moving Average , calculated using Momentum, Acceleration and Probability (Psychological Effect).
Momentum adjusted Moving Average(MaMA) is an indicator that measures Price Action by taking into consideration not only Price movements but also its Momentum, Acceleration and Probability. MaMA, provides faster responses comparing to the regular Moving Average
Here is the math of the MaMA idea
Momentum measures change in price over a specified time period
momentum = source – source(length)
where,
source, indicates current bar’s price value
source(length), indicates historical price value of length bars earlier
Lets play with this formula and rewrite it by moving source(length) to other side of the equation
source = source(length) + momentum
to avoid confusion let’s call the source that we aim to predict as adjustedSource
adjustedSource = source(length) + momentum
looks nice the next value of source simply can be calculated by summing of historical value of the source value and value of the momentum. I wish it was so easy, the formula holds true only when the momentum is conserved/constant/steady but momentum move up or down with the price fluctuations (accelerating or decelerating)
Let’s add acceleration effects on our formula, where acceleration is change in momentum for a given length. Then the formula will become as (skipped proof part of acceleration effects, you may google for further details)
adjustedSource = source(length) + momentum + 1/2 * acceleration
here again the formula holds true when the acceleration is constant and once again it is not the case for trading, acceleration also changes with the price fluctuations
Then, how we can benefit from all of this, it has value yet requires additional approaches for better outcome
Let’s simulate behaviour with some predictive approach such as using probability (also known as psychological effect ), where probability is a measure for calculating the chances or the possibilities of the occurrence of a random event. As stated earlier above momentum and acceleration are changing with the price fluctuations, by using the probability approach we can add a predictive skill to determine the likelihood of momentum and acceleration changes (remember it is a predictive approach). With this approach, our equations can be expresses as follows
adjustedSource = source(length) + momentum * probability
adjustedSource = source(length) + ( momentum + 1/2 * acceleration ) * probability , with acceleration effect
Finally, we plot MaMA with the new predicted source adjustedSource, applying acceleration effect is made settable by the used from the dialog box, default value is true.
What to look for:
• Trend Identification
• Support and Resistance
• Price Crossovers
Recommended settings are applied as default settings, if you wish to change the length of the MaMA then you should also adjust length of Momentum (and/or Probability). For example for faster moving average such as 21 period it would be suggested to set momentum length to 13
Alternative usage , set moving average length to 1 and keep rest lengths with default values, it will produce a predictive price line based on momentum and probability. Experience acceleration factor by enabling and disabling it
Conclusion
MaMA provide an added level of confidence to a trading strategy and yet it is important to always be aware that it implements a predictive approach in a chaotic market use with caution just like with any indicator
Trading success is all about following your trading strategy and the indicators should fit within your trading strategy, and not to be traded upon solely
Disclaimer : The script is for informational and educational purposes only. Use of the script does not constitutes professional and/or financial advice. You alone the sole responsibility of evaluating the script output and risks associated with the use of the script. In exchange for using the script, you agree not to hold dgtrd TradingView user liable for any possible claim for damages arising from any decision you make based on use of the script
Acceleration
Renko AccelerationRenko is a very useful charting method for analyzing stock movement. It does a great job of filtering out all the excess noise so that all we're left with is pure price action. But, what about time? Time is a fundamental part of chart analysis and we are only seeing part of the picture. After all, shouldn't we take a very different approach to trading signals from a block that renders in 2 seconds as opposed to a block that renders in 30 minutes?
This indicator provides the best of both worlds, enabling us to correlate the passing of time with price movement and clearly see when squeezes and breakouts occur.
As the indicator turns up to green we can see that volatility is on the move and the market is accelerating (breakout), and as it turns down to red the market is stagnating (squeeze). There is also an alternate 'Precise' view which renders the exact time per block for more granular analysis.

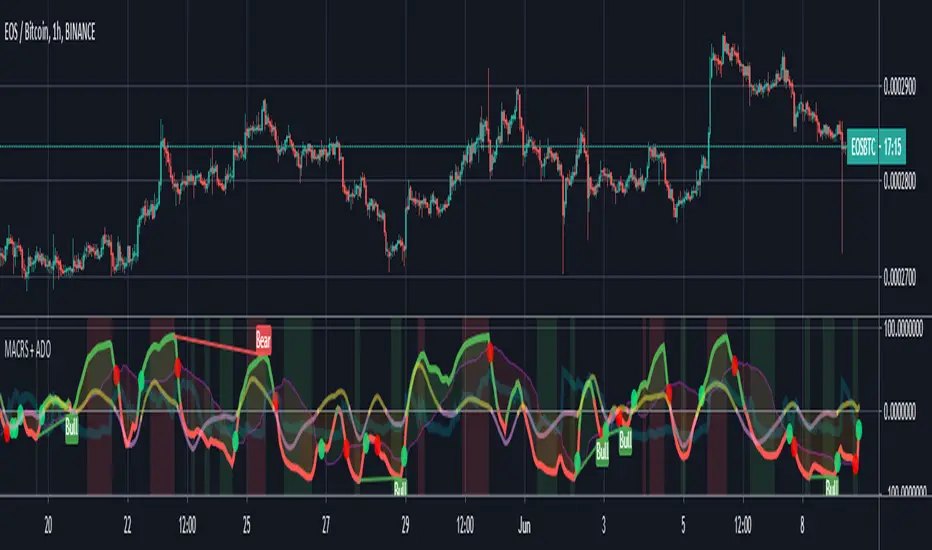
MACD modulated RSIThe main oscillator is the RSI modulated by the MACD (default). The RSI mode can be disabled to revert to a normal MACD oscillator for the main oscillator.
When the main oscillator (thicker line) is > 0, it is green; and if it is < 0, it is red.
The MACD can be re-scaled and whenever its value > 100, a background fill between the oscillator and the zeroline appear to indicates overbought condition; and < -100 indicates oversold condition. The user can tweak the scaling factor to optimize this for a given chart and timeframe.
A proprietary asymmetric differential oscillator (ADO) is also implemented, which is modulated by the main oscillator. When this (thinner line) secondary oscillator is > 0, it is yellow; and when it is < 0, it is lavender. The user can select the order of the differential (i.e. Order 1 = Momentum, Order 2 = Acceleration, Order 3 = Jerk, Order 4 = Snap, Order 5 = Crackle, Order 6 = Pop). This oscillator provides details of the more subtle underlying/hidden trends that is emerging or brewing, and may hint of an incoming move ahead of time. Divergence in the sign and slope of this secondary oscillator with respect to the main oscillator may provide a useful edge for trade setup.
A (thick transparent light blue) volume oscillator is also provided. An increase in volume trend provides confirmation of (or solidifies) the movements in the main oscillator over that period. A falling volume oscillator trend raises doubts on the main oscillator trend, and hints of the possibility of a counter-trend (also look at the secondary ADO oscillator for clues).
The novel aspects and principles of this indicator and this source code are the property of © cybernetwork.
This indicator and script is free for the TV community to use.
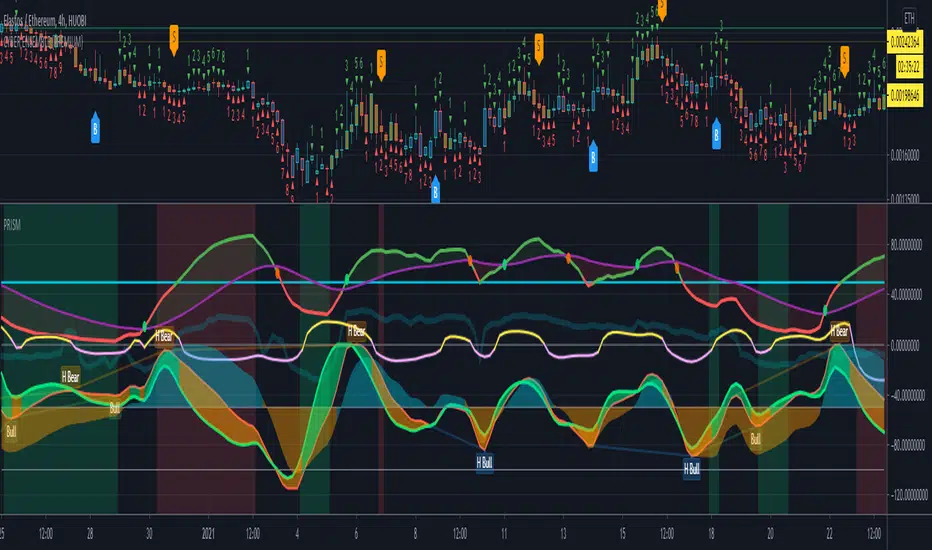
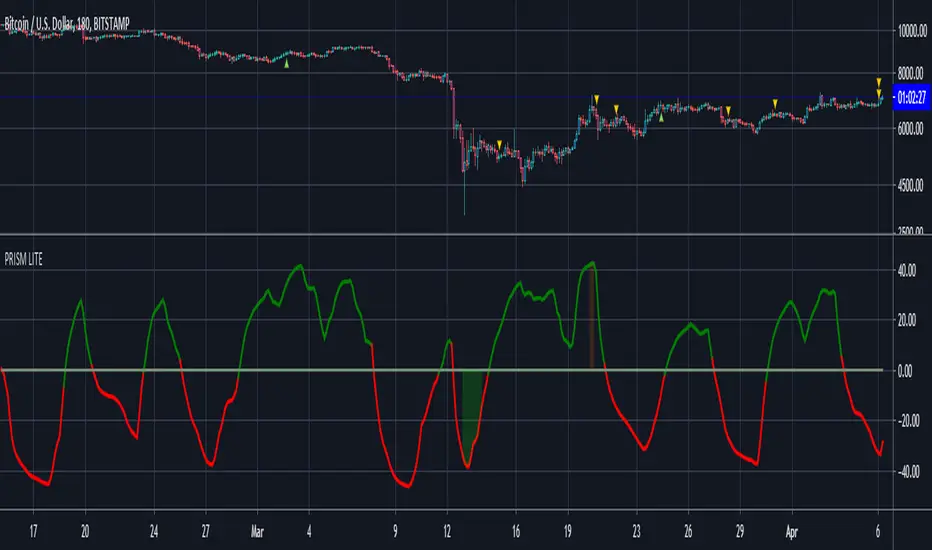
PRISM Oscillators Set {PREMIUM}The PRISM Oscillator Set consists of:
(1) A modified-pSAR derived main driving oscillator (P-Oscillator).
(2) With MAJeStic (Momentum, Acceleration, Jerk, Snap) Oscillators Set (M-, A-, J-, S-Oscillators respectively).
User can switch the main oscillator to RSI-mode (default), as well as reverting to configurable EMA/SMA MACD mode as well.
The P-Oscillator
The P-Oscillator (centered at 50 in the y-axis) indicates the instantaneous bullish/bearish cycle of the market, and the degree of which.
A MA-line is provided as well (VWMA-mode is set as the default, but user can choose to switch to SMA-mode).
The crossing of the P-Oscillator into its MA-line signals a significant turn in the P-Oscillator , similar to how the cross between MAs are being used to signal a golden/death-cross (example: P-Oscillator crossing down its MA-line indicates a probable shift into the bearish phase).
The MAJeStic-Oscillators
The MAJeStic-Oscillators are derived from the main P-Oscillator .
The M-Oscillator is the momentum oscillator, to more clearly visually indicate the current momentum phase of the main P-Oscillator -- i.e. when the oscillator is above the zeroline at -50, the P-oscillator is in an uptrend; and the magnitude of which indicates the velocity (or to be more precise, the speed) of the current momentum trend.
The AJ-Ribbon consists of the acceleration and jerk oscillators, to indicate the hidden underlying trends in the momentum. They can be thought of as the hidden force/hand that pushes and pulls the momentum oscillator upwards or downwards.
Both the M-Oscillator and the AJ-Ribbon are y-shifted down with its zeroline set at -50, simply for the purpose of clarity of presentation for this multiple-oscillator script.
The S-Oscillator is centered about the 0 as its zeroline. It is a highest-order indicator, derived from the AJ-Ribbon , and is an extremely sensitive indicator -- which is able to dig up even the more subtle market trends that may later cascade into a more macro trend. For example: when it crosses from the negative into the positive (especially with a steeply positive slope) and holds above the zeroline, it is then likely that price will see some upside movement ahead (depending on the magnitude of the oscillator as well), even if it may presently be simply moving sideways or even downwards (i.e. a divergence in the S-oscillator wrt the current price movement).
The alignment of the various indicators gives the clearest signal of the market trend, however, that naturally isn't always the case. Hence, when signals from the oscillators looks conflicted, the higher order oscillators (i.e. the AJ-Ribbon, and the S-Oscillator) will be helpful indicators of possible movement incoming; alternatively looking for divergence and hidden divergence of the P-Oscillator (set to RSI-mode) is also an effective strategy.
This oscillator set is suitable to be applied on any timeframes and on any charts.
This oscillator does not give precise price targets, but only offers a qualitative view of the present as well as the probable incoming price action.
To (attempt to) predict price targets, I personally use the PRISM Oscillator Set in conjunction a combination of various support & resistance analytical strategies: e.g. VPVR-levels, moving averages, trend-lines, Ichimoku Cloud, etc. and looking/waiting for sufficient candle closing and break-outs for confirmation, etc.
The PRISM Oscillator Set provide a momentum-focused perspective of the current market.
While my other script, Cyber Ensemble ( which generates buy/sell signals base on the scoring of a large ensemble of technical indicators + and modified by a series of filters ), provides a technical perspective of the current market; and which I frequently use conjunction with the PRISM Oscillator Set .
~ * ~ * ~ * ~ * ~ * ~ * ~ * ~ * ~ * ~ * ~ * ~ * ~ * ~ * ~ * ~ * ~ * ~ * ~ * ~ * ~
Note:
In no way is this intended as a financial/investment/trading advice. You are responsible for your own investment/trade decisions.
Please exercise your own judgement for your own trades base on your own risk-aversion level and goals as an investor or a trader. The use of OTHER indicators and analysis in conjunction (tailored to your own style of investing/trading) will help improve confidence of your analysis, for you to determine your own trade decisions.
~ * ~ * ~ * ~ * ~ * ~ * ~ * ~ * ~ * ~ * ~ * ~ * ~ * ~ * ~ * ~ * ~ * ~ * ~ * ~ * ~
Please PM me for access information.
© cybernetwork
Correlation Coefficient {Cybernetwork}Correlation Coefficient (CC): with CC momentum and acceleration oscillators, and momentum-divergence indicator.

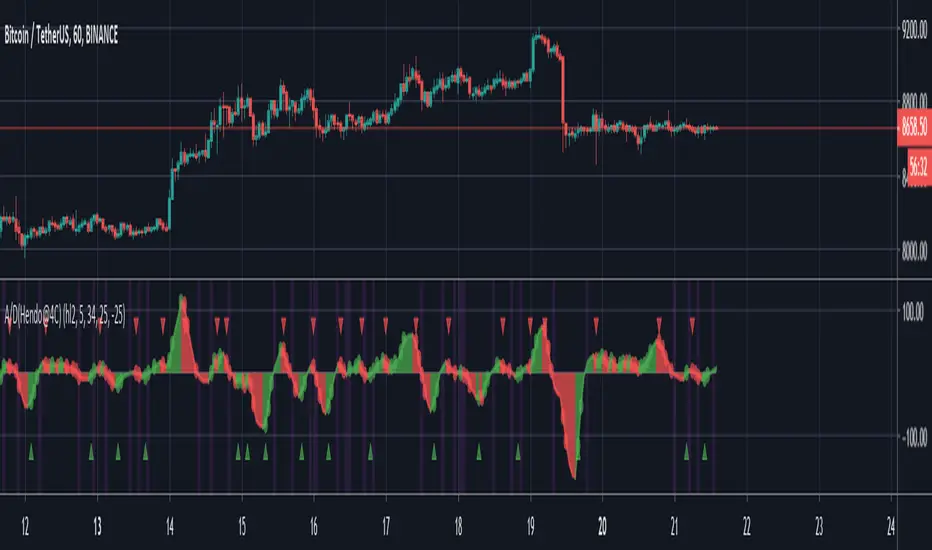
Acceleration/Deceleration with alerts (Hendo@4C)My variation of the Acceleration/Deceleration by Bill Williams. I found the existing variations of this indicator on TradingView severely lacking in terms of options. Credits go to a close friend who recommended writing this.
NOTE: The setting called: "Invert acceleration dots", can make gauging tops and bottoms "earlier" easier. Due to the nature of this indicator and the fact that you can set alerts on deceleration.
//Overview of settings//
“Plot tops and bottoms” default: True
An option to enable plotting shapes when a top or bottom is printed. I use a non conventional way to detect tops and bottoms. This secures false signals. Alerts can be added to this.
“Fill background” default: True
Fills the background between the A/D and the 0 line.
“Source for A/D” default: (high+low)/2
This is the source for calculation of the indicator. Bill Williams himself describes using the “HL2” and this is what the default value is. Potentially once could experiment with “HLC3” (high+low+close)/3. Since this is also a popular way of using this indicator.
“Length of F-SMA” default: 5
The length of the fast simple moving average that the indicator uses. Again: The default is 5 but one could experiment with higher/lower values to change the reaction time of the indicator.
“Length of S-SMA” default: 34
The lenght of the slow simple moving average that the indicator uses. The default by Bill Williams here is 34. One could experiment with higher values to reduce noise.
“Activate less noise mode” default: False
Uses a proprietary way of averaging values in price. This creates an entirely new indicator in itself. Can be very useful for trading the lower timeframes. It is however advised to understand that enabling this settings will not make the indicator the “standard A/D // AC” anymore.
“Plot alert levels” default: False
This setting allows you to plot extra levels at certain values (just like the RSI for example). Keep in mind however that you need to manually adjust the values to fit the instrument you’re trading. Of course you can set alerts to these levels. Be careful enabling this: Since it might pull the chart out of proper scaling.
“Value of +Line plot” default: 25”
Sets the level of the first “alert level” described earlier. I picked 25 as an example for Bitcoin. Be careful setting these levels: Since it might pull the chart out of proper scaling.
“Value of -Line plot” default: -25”
Sets the level of the second “alert level” described earlier. I picked -25 as an example for Bitcoin. Be careful setting these levels: Since it might pull the chart out of proper scaling.
“Fill background between lines” default: False
Enabling this will fill the background between the previously discussed +Line plot and the -Line plot. Again: Much like RSI.
“Color background if 0 is crossed” default: True
Colors the background of the indicator everytime the 0 line is crossed. Of course alerts can be set up in order to push an alert every time this happens. The default color for this is “Fuchsia”. Because it contrasts well.
“Show visual accel/decel” default: True
Uses a few simple mathematical functions in order to calculate if the A/D is accelerating or decelerating. If enabled it will plot dots when the A/D is accelerating up or accelerating down: Meaning: When the change is more rapid than the previous change (hence acceleration).
"Invert acceleration dots" default: False
Changes the previous function mentioned: Let’s say you don’t want to know acceleration but you want to know the the A/D is decelerating (meaning: The change is less rapid than the previous change). You can enable this setting. If you enable this it will plot dots on the A/D when we’re decelerating instead of accelerating. (hence deceleration).
"Color entire background of A/D" default: False
In case you desire to plot the entire background of the indicator you can enable this setting. Might make it a little bit more easy to spot changes in the A/D (especially when using multiple indicators).
That’s all in terms of settings. Most of these settings also describe the use case.
The use case as described by TradingView is the following:
“The Accelerator Oscillator (AC) is an indicator developed by Bill Williams that helps traders gauge changes in momentum. It is based on the Awesome Oscillator (AO) and measures the difference between that indicator and its 5-period moving average, effectively showing how quickly the AO changes and predicting what it will do next. If the AC is in positive territory, the upward acceleration is likely to continue. If the AC is in negative territory, the downward acceleration is likely to continue. The bars in the histogram have 2 colors: red indicating a fall in price and green indicating a rise in price. Various specific buy and sell signals can be derived from the color of the bars and whether they are above or below the 0-line.”
I’ve decided to add any alert I could think of: Meaning there are in total 22 customizable alerts to set up when using this indicator. If you have any conditions that I forgot to add feel free to leave a comment.
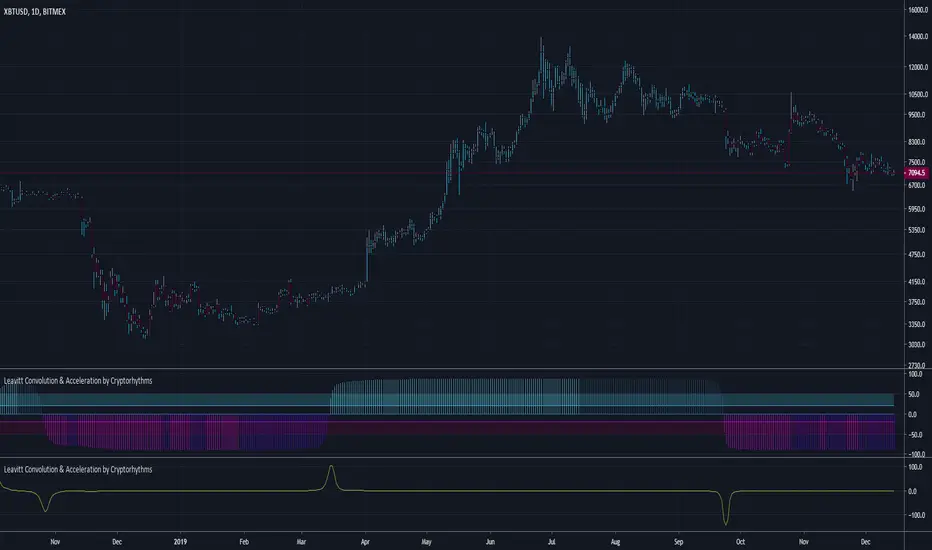
Leavitt Convolution & Acceleration by CryptorhythmsLeavitt Projection, Convolution, & Acceleration by Cryptorhythms
Intro
Bringing you another open source Gem this time from the January 2020 Issue of TASC.
Description
In the article in the Oct 2019 TASC issue titled "An interplanetary marriage" author Jay Leavitt describes the evolution process required in strategy design by introducing his Mars strategy. This grew out of concepts presented in his earlier TASC articles such as the stratosphere, moon rocket, and tech emini strategies. This dual indicator uses a linear regression of price data to help derive slope and acceleration information, in turn helping him to identify trends and trend turning points.
Additions
As usual a few useful extras are included such as a rudimentary signaling system, bar coloration by trade state, overbought/oversold areas to assist in algorithmic setups, and more!
👍 We hope you enjoyed this indicator and find it useful! We post free crypto analysis, strategies and indicators regularly. This is our 71st script on Tradingview!
💬Check my Signature for other information
SNAC - AccelerationAcceleration / Deceleration Oscillator (AC) measures the acceleration and deceleration of the current momentum.
Bill Williams says that before the price behaviour changes, the momentum changes and, even before the momentum, we see the change in the acceleration.
A buy above the zero line signal is generated when there are two consecutive green histogram bars. Opposite is true for a sell signal.

R100 Volatility Combo Bands v1 (*v*)The Volatility Combo Bands are made from 4 separate volatility bands- two Bollinger Bands (10 and 20 period) and two Price Headley Acceleration Bands (10 and 20 period). The Volatility Combo Bands plot the innermost upper and lower points from these bands and then plots a mid-line. By default, only the standard 20 period Bollinger Bands and Combo Bands with mid-line are displayed, but can be configured however you want.
Try it out- see squeezes earlier, ride the bands earlier in trending markets, trade pullbacks to the Combo Bands and mid-line, trade the range of the band or use them to help identify potential support and resistance levels. Hopefully they can add another dimension to identifying volatility contraction patterns or whatever you currently use these things for!
I hope you get some value out of it. Only conditions of use are that if you improve it, let me know and if you publish something that uses it, don't hide the code! Enjoy!
Code for the Price Headley Acceleration Bands pinched and modified from LazyBear - thankyou.

PRISMpSAR derived oscillator with its set of RSI & StochRSI and MAJestic (Momentum, Acceleration, Jerk) Oscillators Set
pSAR and MAJ oscillators can be disabled and hidden.
~ * ~ * ~ * ~ * ~ * ~ * ~ * ~ * ~ * ~ * ~ * ~ * ~ * ~ * ~ * ~ * ~ * ~ * ~ * ~ * ~
Note:
In no way is this intended as a financial/investment/trading advice. You are responsible for your own investment decisions and trades.
Please exercise your own judgement for your own trades base on your own risk-aversion level and goals as an investor or a trader. The use of OTHER indicators and analysis in conjunction (tailored to your own style of investing/trading) will help improve confidence of your analysis, for you to determine your own trade decisions.
~ * ~ * ~ * ~ * ~ * ~ * ~ * ~ * ~ * ~ * ~ * ~ * ~ * ~ * ~ * ~ * ~ * ~ * ~ * ~ * ~
Please check out my other indicators sets and series, e.g.
LIVIDITIUM (dynamic levels),
AEONDRIFT (multi-levels standard deviation bands),
FUSIONGAPS (MA based oscillators),
MAJESTIC (Momentum/Acceleration/Jerk Oscillators),
PRISM (pSAR based oscillator, with RSI/StochRSI as well as Momentum/Acceleration/Jerk indicators),
PDF (parabolic SAR /w HighLow Trends Indicator/Bar-color-marking + Dynamic Fib Retrace and Extension Level)
and more to come.
Constructive feedback and suggestions are welcome.
If you like any of my set of indicators, and it has benefited you in some ways, please consider tipping a little to my HRT fund. =D
cybernetwork @ EOS
37DzRVwodp5UZBYjCKvVoZ5bDdDqhr7798 @ BTC
MPr8Zhmpsx2uh3F5R4WD98MRJJpwuLBhA3 @ LTC
1Je6c1vvSCW7V2vA6RYDt6CEvqGYgT44F4 @ BCH
AS259bXGthuj4VZ1QPzD39W3ut4fQV5giC @ NEO
rDonew8fRDkZFv7dZYe5w3L1vJSE51zFAx @ Ripple XRP
0xc0161d27201914FC0bAe5e350a193c8658fc4742 @ ETH
GAX6UDAJ52OGZW4FVVG3WLGIOJLGG2C7CTO5ZDUK2P6M6QMYBJMSJTDL @ Stellar XLM
xrb_16s8cj8eoangfa96shsnkir3wctdzy76ajui4zexek6xmqssweu85rdjxrt4 @ Nano
~ JuniAiko
(=^~^=)v~
Cyber Momentum StrategyStrategy base on the PRISM Oscillators Set as it foundation, with stop-loss algorithm integrated.
~ * ~ * ~ * ~ * ~ * ~ * ~ * ~ * ~ * ~ * ~ * ~ * ~ * ~ * ~ * ~ * ~ * ~ * ~ * ~ * ~
Note:
In no way is this intended as a financial/investment/trading advice. You are responsible for your own investment decisions and trades.
Please exercise your own judgement for your own trades base on your own risk-aversion level and goals as an investor or a trader. The use of OTHER indicators and analysis in conjunction (tailored to your own style of investing/trading) will help improve confidence of your analysis, for you to determine your own trade decisions.
~ * ~ * ~ * ~ * ~ * ~ * ~ * ~ * ~ * ~ * ~ * ~ * ~ * ~ * ~ * ~ * ~ * ~ * ~ * ~ * ~
Please check out my other indicators sets and series, e.g.
LIVIDITIUM (dynamic levels),
AEONDRIFT (multi-levels standard deviation bands),
FUSIONGAPS (MA based oscillators),
MAJESTIC (Momentum/Acceleration/Jerk Oscillators),
PRISM (pSAR based oscillator, with RSI/StochRSI as well as Momentum/Acceleration/Jerk indicators),
PDF (parabolic SAR /w HighLow Trends Indicator/Bar-color-marking + Dynamic Fib Retrace and Extension Level)
and more to come.
Constructive feedback and suggestions are welcome.
To continue to keep this strategy free to use, especially if it has benefited your trades, please consider tipping a little of any gains you've made to my HRT fund. =D
cybernetwork @ EOS
37DzRVwodp5UZBYjCKvVoZ5bDdDqhr7798 @ BTC
MPr8Zhmpsx2uh3F5R4WD98MRJJpwuLBhA3 @ LTC
1Je6c1vvSCW7V2vA6RYDt6CEvqGYgT44F4 @ BCH
AS259bXGthuj4VZ1QPzD39W3ut4fQV5giC @ NEO
rDonew8fRDkZFv7dZYe5w3L1vJSE51zFAx @ Ripple XRP
0xc0161d27201914FC0bAe5e350a193c8658fc4742 @ ETH
GAX6UDAJ52OGZW4FVVG3WLGIOJLGG2C7CTO5ZDUK2P6M6QMYBJMSJTDL @ Stellar XLM
xrb_16s8cj8eoangfa96shsnkir3wctdzy76ajui4zexek6xmqssweu85rdjxrt4 @ Nano
~ JuniAiko
(=^~^=)v~

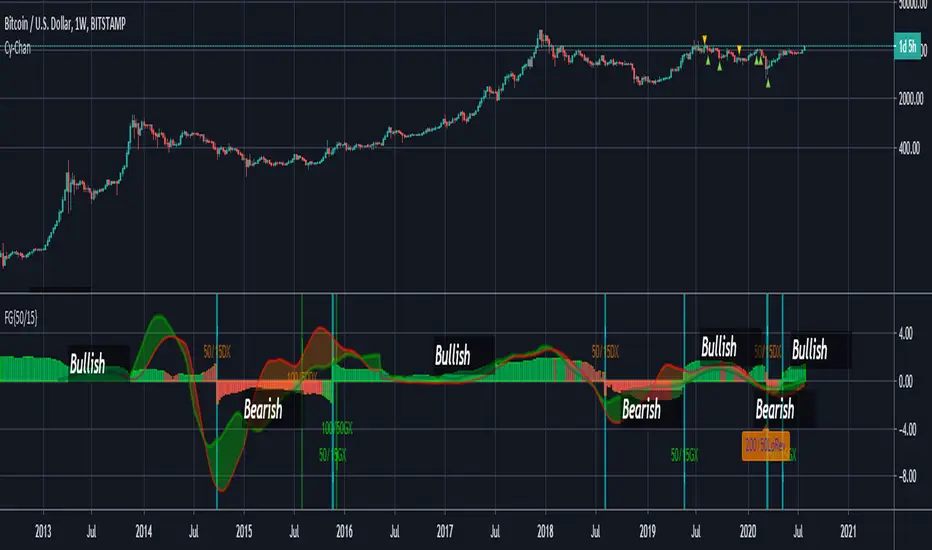
FUSIONGAPS V4 {50/15-Series}Base on the FUSIONGAPS oscillator series, but Only the 50/15 oscillator is plotted, and with Momentum and Acceleration oscillators added.
The thickest line is the FG oscillator: Red/Green coloring indicates if the market is in a Bearish/Bullish period.
The green colored line is the DFG oscillator (DIFFERENTIAL FUSIONGAPS: Price Momentum)
The red colored line is the D2FG oscillator (DOUBLE-DIFFERENTIAL FUSIONGAPS: Price Acceleration)
Indicators:
DeathCrosses ( DX ) and GoldenCrosses ( GX )
Momentum Reversal indicators (D2FG based filter applied to reduce false-positives, but can be manually disabled.)
~ * ~ * ~ * ~ * ~ * ~ * ~ * ~ * ~ * ~ * ~ * ~ * ~ * ~ * ~ * ~ * ~ * ~ * ~ * ~ * ~
Note:
In no way is this intended as a financial/investment/trading advice. You are responsible for your own investment decisions and trades.
Please exercise your own judgement for your own trades base on your own risk-aversion level and goals as an investor or a trader. The use of OTHER indicators and analysis in conjunction (tailored to your own style of investing/trading) will help improve confidence of your analysis, for you to determine your own trade decisions.
~ * ~ * ~ * ~ * ~ * ~ * ~ * ~ * ~ * ~ * ~ * ~ * ~ * ~ * ~ * ~ * ~ * ~ * ~ * ~ * ~
Please check out my other indicators sets and series, e.g.
LIVIDITIUM (dynamic levels),
AEONDRIFT (multi-levels standard deviation bands),
FUSIONGAPS (MA based oscillators),
MAJESTIC (Momentum/Acceleration/Jerk Oscillators),
PRISM (pSAR based oscillator, with RSI/StochRSI as well as Momentum/Acceleration/Jerk indicators),
PDF (parabolic SAR /w HighLow Trends Indicator/Bar-color-marking + Dynamic Fib Retrace and Extension Level)
and more to come.
Constructive feedback and suggestions are welcome.
~ JuniAiko
(=^~^=)v~
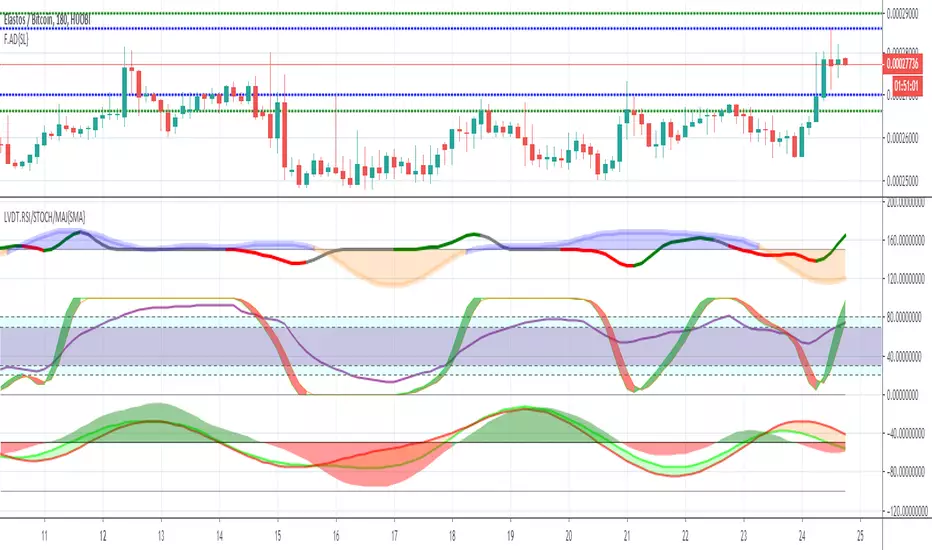
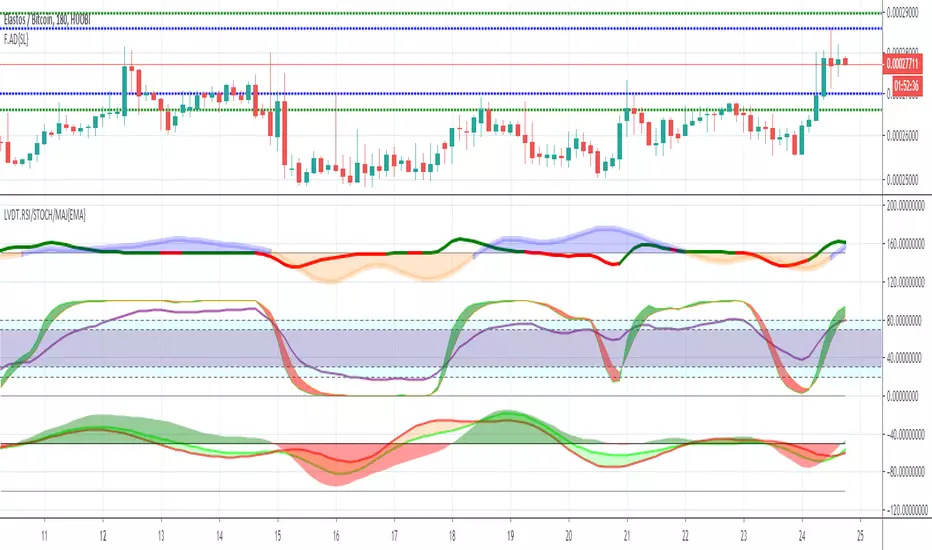
LIVIDITIUM RSI/STOCH/MAJ Oscillator Set {SMA}LVDT RSI oscillator
LVDT STOCHASTIC-RSI oscillator
LVDT MAJ (Momentum/Acceleration/Jerk) oscillators + signals ( Default = Disabled)
~JuniAiko
(=^~^=)v~
LIVIDITIUM RSI/STOCH/MAJ Oscillator Set {EMA}LVDT RSI oscillator
LVDT STOCHASTIC-RSI oscillator
LVDT MAJ (Momentum/Acceleration/Jerk) oscillators + signals ( Default = Disabled)
~JuniAiko
(=^~^=)v~
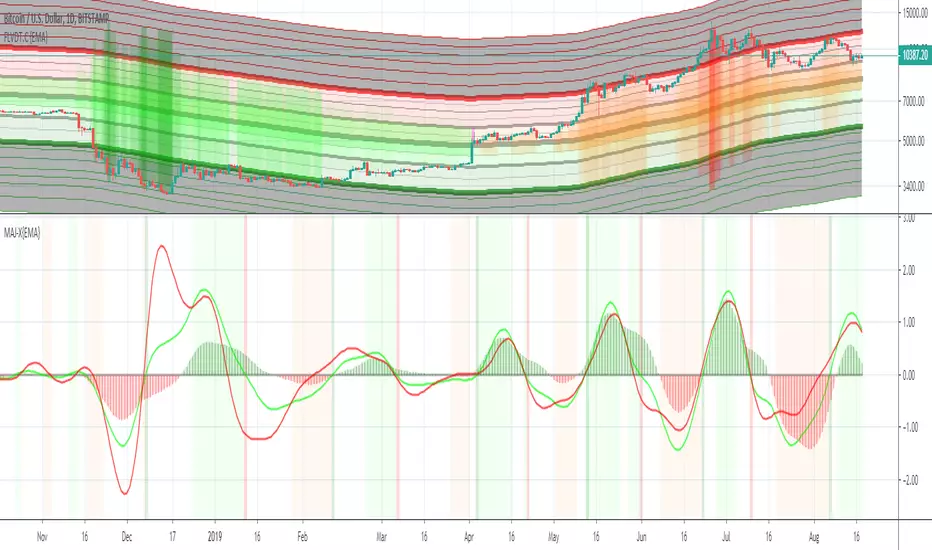
MAJESTIC-X {EMA}The MAJESTIC (MAJ) is a set of M omentum/ A cceleration/ J erk oscillators.
This "X" edition comes with optimized time-frames to be used as a companion with the Fast LIVIDITIUM Channel (FLVDT.C).
The option to switch to custom time-frames is also available in this version.
The filled-histogram is the Momentum oscillator
The lime colored line is the Acceleration oscillator
The red colored line is the Jerk oscillator
The analysis candles-range have been optimized for the following time-frames:
monthly (1M) = 1
3W = 1
2W = 2
weekly (1W) = 4
5D = 6
4D = 8
3D = 10
2D = 15
daily (1D) = 30
240 hr = 80
Note: In no way is the MAJESTIC oscillator intended as a financial/investment/trading advice. You are responsible for your own investment decisions and trades.
Please exercise your own judgement for your own trades base on your own risk-aversion level and goals as an investor or a trader. The use of OTHER indicators and analysis in conjunction (tailored to your own style of investing/trading) will help improve confidence of your analysis, for you to determine your own trade decisions.
~JuniAiko
(=^~^=)v~
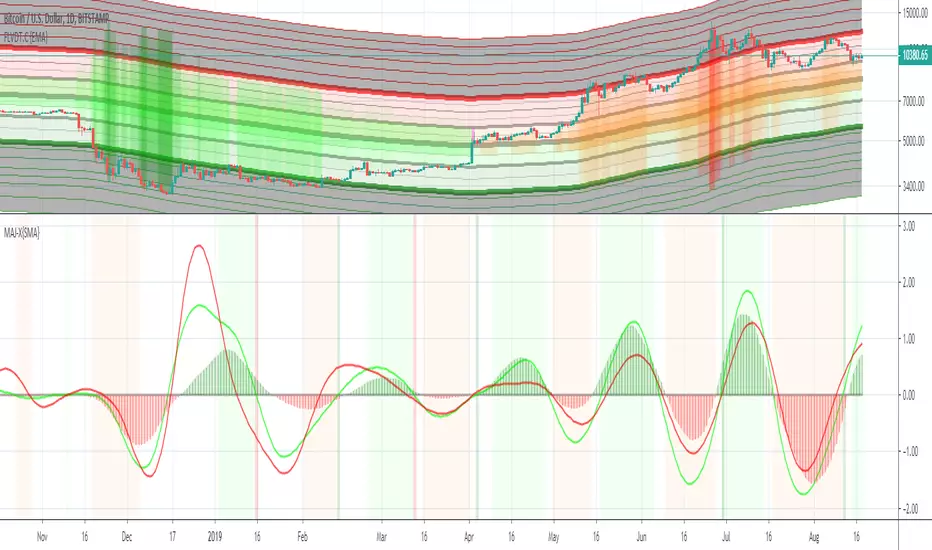
MAJESTIC-X {SMA}The MAJESTIC (MAJ) is a set of M omentum/ A cceleration/ J erk oscillators.
This "X" edition comes with optimized time-frames to be used as a companion with the Fast LIVIDITIUM Channel (FLVDT.C).
The option to switch to custom time-frames is also available in this version.
The filled-histogram is the Momentum oscillator
The lime colored line is the Acceleration oscillator
The red colored line is the Jerk oscillator
The analysis candles-range have been optimized for the following time-frames:
monthly (1M) = 1
3W = 1
2W = 2
weekly (1W) = 4
5D = 6
4D = 8
3D = 10
2D = 15
daily (1D) = 30
240 hr = 80
Note: In no way is the MAJESTIC oscillator intended as a financial/investment/trading advice. You are responsible for your own investment decisions and trades.
Please exercise your own judgement for your own trades base on your own risk-aversion level and goals as an investor or a trader. The use of OTHER indicators and analysis in conjunction (tailored to your own style of investing/trading) will help improve confidence of your analysis, for you to determine your own trade decisions.
~JuniAiko
(=^~^=)v~
MAJESTIC {EMA}The thickest blue line is the Momentum oscillator
The lime colored line is the Acceleration oscillator
The red colored line is the Jerk oscillator
This is the {EMA} implementation.
~JuniAiko
(=^~^=)v~

MAJESTIC {SMA}The thickest blue line is the Momentum oscillator
The lime colored line is the Acceleration oscillator
The red colored line is the Jerk oscillator
This is the {SMA} implementation.
~JuniAiko
(=^~^=)v~


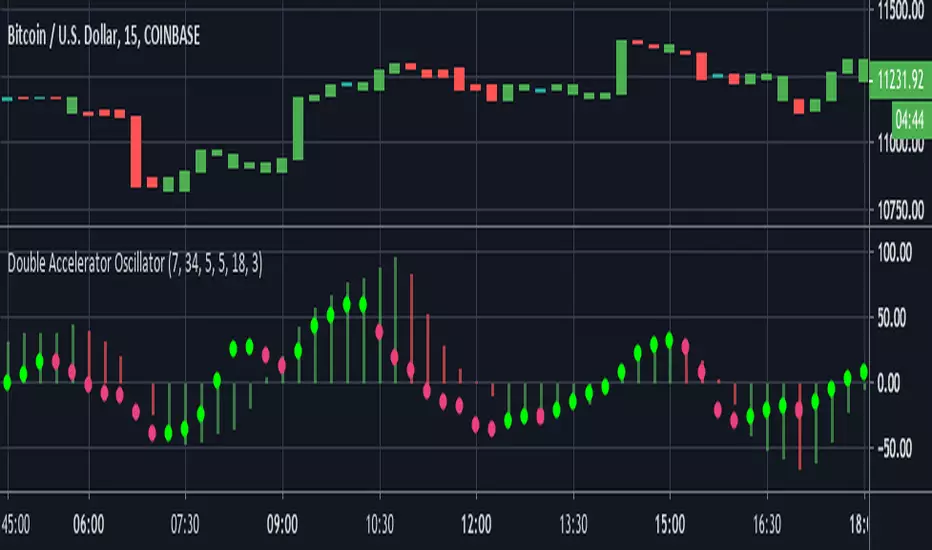
Double Accelerator OscillatorThis is a modified version of Bill Williams' Accelerator. The Accelerator measures the difference between the Awesome Oscillator(another Williams indicator) and its 5 day SMA.
This script plots 2 accelerators rather than 1. Users can define the lengths of the fast and slow SMA's used in the Awesome Oscillator calculation by adjusting the options in the input menu.
We set the default the lengths of the fast and slow SMA's used in the first Awesome Oscillator calculation as 34 and 7 periods. Then to find the Accelerator Oscillator, the difference between the Awesome Oscillator and its 7 period SMA is calculated. The second Accelerator uses shorter window lengths than the first. The fast SMA length is 5 by default and the slow SMA length is 18. Finally, the length of the Awesome Oscillator SMA used to calculate the second Accelerator Oscillator is 3.
By utilizing two Accelerator Oscillators with increasingly shorter window lengths, this indicator identifies changes in momentum very well.
The red and green histogram represents the first Accelerator Oscillator. It is green when the Accelerator is increasing and red when it is decreasing. I found this layout to be more practical than the standard, which plots the AC as green when it is greater than 0 and red when less than zero. The second Accelerator Oscillator is plotted as the bright green and pink circle line. It uses the same coloring conditions as above.
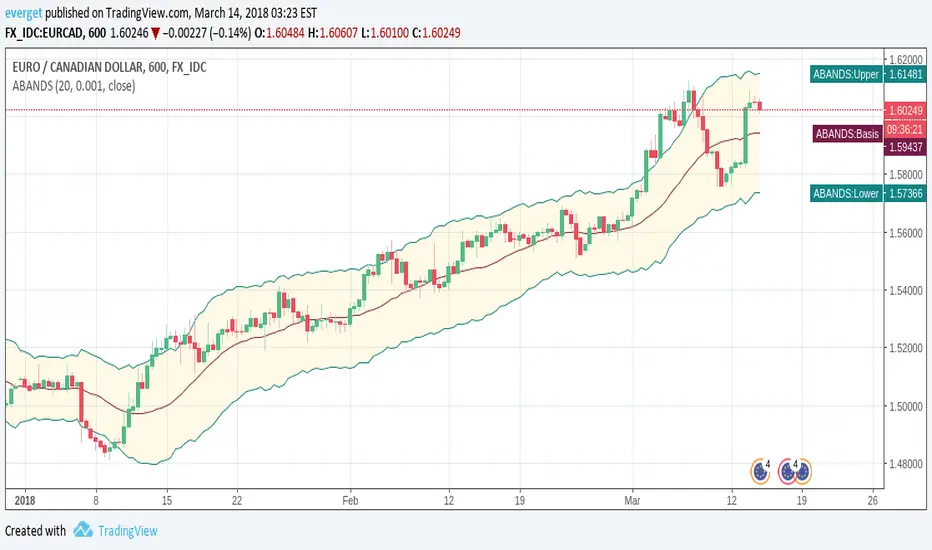
Acceleration BandsAcceleration Bands indicator script. This indicator was originally developed by Price Headley.
MaxWarren's Pine Acceleration - 2nd DerivativeThis is the acceleration of a chart written in pine. It's the second derivative otherwise the derivative of the momentum.
It shows how fast a stock's momentum is changing and in what direction.
As standard I left the controls in the settings for source and length of the estimate.
I will be incorporating this in other more complicated scripts here shortly
