Ultimate Major Contextual Dashboard (Multi-Asset)Overview : The Ultimate Major Dashboard is a performance-optimized market overview tool designed to provide a consolidated snapshot of the 7 major Forex pairs and Gold. It aggregates correlation, trend, momentum, and volatility data into a single, clean table, allowing users to view broader market context without switching charts.
Technical Logic & Components : This indicator utilizes a modular function to analyze EURUSD, GBPUSD, USDJPY, USDCHF, AUDUSD, USDCAD, NZDUSD, and XAUUSD across four key dimensions:
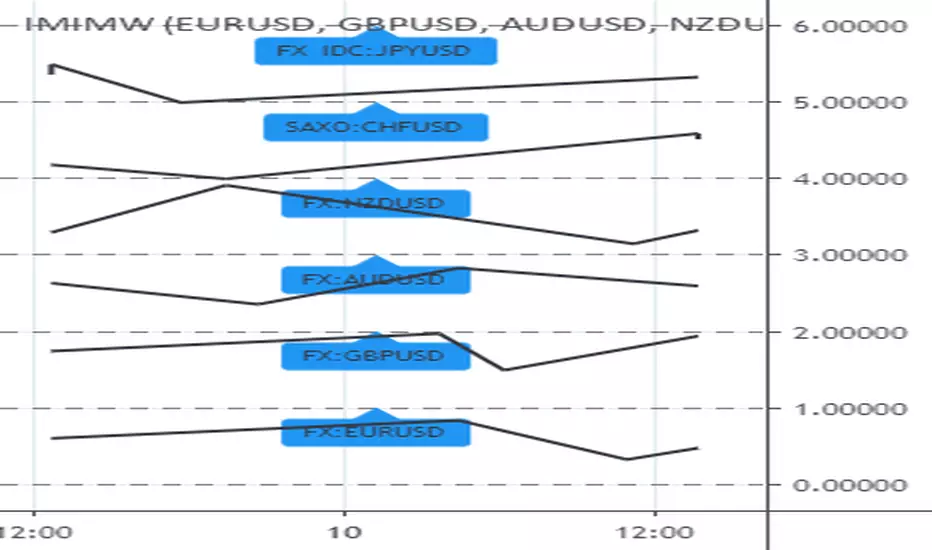
Intermarket Correlation (Pearson Coefficient): Uses ta.correlation() to compare each asset against the symbol currently on your main chart.
Logic: Values above 0.7 (Dark Green) suggest a strong positive relationship, while values below -0.7 (Dark Red) suggest inverse behavior. This is calculated over a rolling 50-period window to balance stability with current market sensitivity.
Trend Bias (EMA-200): Evaluates the long-term trend by checking price position relative to the 200-period Exponential Moving Average.
Visuals: An upward arrow (⬆) indicates price is above the EMA; a downward arrow (⬇) indicates it is below.
Momentum (RSI-14): Calculates the Relative Strength Index. The dashboard automatically highlights readings above 70 (OB) or below 30 (OS) to help identify potential momentum extremes.
Volatility (ATR-14): Displays the Average True Range as a reference for the current active range of each market, helping users compare volatility levels across the majors.
How to Interpret the Dashboard
Asset Alignment: Correlation values help identify when pairs are moving in "unison" versus when a specific currency is diverging from the group.
Directional Context: Combining the Trend (EMA) and Momentum (RSI) columns provides a quick view of whether a market is trending strongly or reaching an exhaustion point.
Volatility Benchmarking: The ATR values offer perspective on which pairs are currently the most active, assisting in market comparison based on volatility preference.
Data Handling & Customization
Multi-Symbol Sync: Data is fetched using request.security(). The calculations are synchronized with the chart's current bar state for real-time accuracy.
Dynamic TF: Users can select the analysis timeframe (60, 240, D, W) via the settings menu.
Flexibility: The dashboard position can be toggled between all four corners of the chart to avoid overlapping with price action.
Disclaimer
This tool is provided for analytical and educational purposes only. It does not generate trading signals and should not be considered financial advice.
Indicateur Pine Script®