Market Range OracleMarket Range Oracle is an advanced volatility-adaptive projection tool designed to help traders anticipate future price behaviour, identify probabilistic ranges, and understand how markets historically expand or contract from the price open.
📊 By analysing historical bar-to-bar performance, ATR-filtered volatility, and fast-RSI momentum, the indicator creates a complete forward-looking range map for any timeframe.
📈 What Market Range Oracle Does
Calculates Expected Price Movement From the Open for any selected timeframe, the indicator measures thousands of past bars (or your chosen lookback) to determine:
Average % Gain
Average % Loss
Max Adjusted Gain (ATR-filtered projected peaks)
Max Adjusted Loss (ATR-filtered projected troughs)
Rate of green and red candle closes in the selected lookback period
Projected price levels for all of the above
These projections are then plotted directly on the chart or drawn as offset lines with detailed labels, all the colours, text size, show/hide elements are customisable from the indicator dashboard.
🧠 How does work and how to use it
The indicator computes projections across three independent timeframes:
Plots Timeframe — where visual projection bands are drawn
Lines & Labels Timeframe — creates separate-TF projection levels & labels
Forecast Timeframe — allows forward bar forecasting for the next candle
Forecast projections (when enabled) can be used to show the next future candle of any timeframe.
Example 1: Plots Timeframe set to current timeframe and the Forecast Timeframe option to the same timeframe, this will show an adaptive range moving with the price for current timeframe.
Example 2 : Find the potential Future range long term, the current timeframe is an weekly and we set the Forecast Timeframe to 2 weeks, as want to see potential top and bottom range for the next 2 weeks
Example 3 : Scalping with Market Range Oracle - Set the Bands to current timeframe and set the Projections lines and labels to a higher timeframe (in our case 15 minutes and a 4h)
⚡ Momentum Overlay (Fast RSI Hybrid)
A fast-RSI (RSI-2) colour code system measures short-term momentum and the top and bottom of the ranges display momentum.
Also the middle RSI 50 value equivalent EMA shows directional bias visualized with colour-shifting dashed line on the chart to help traders with clear trend direction.
🔔 Built-In Alert System
Alerts trigger on Price-Level Events and on momentum shift:
Price reaches projected Avg Loss
Price reaches projected Max Gain
Price reaches projected Max Loss
Midpoint Cross Events
Price crosses above mid-range
Price crosses below mid-range
Fast RSI bullish momentum
Fast RSI bearish momentum
Fast RSI strong bullish spike
Fast RSI strong bearish spike
🧩 Market Range Oracle is ideal for scalping, day-trading, swing trading, and position traders.
💬 Notes
Market Range Oracle does not predict future price — it projects statistically probable ranges based on historical behaviour and volatility. It is a decision-support tool to help traders navigate expected expansion from the open.
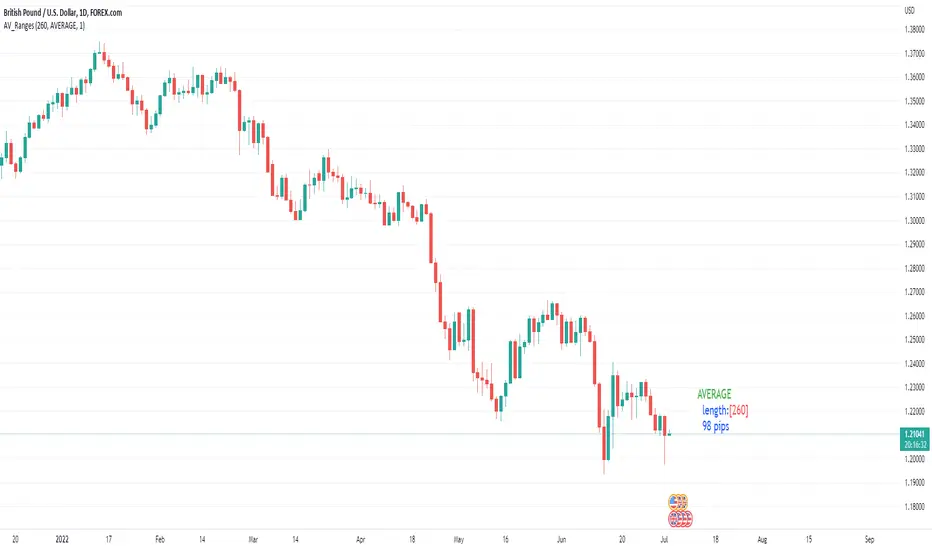
Averagedailyrange

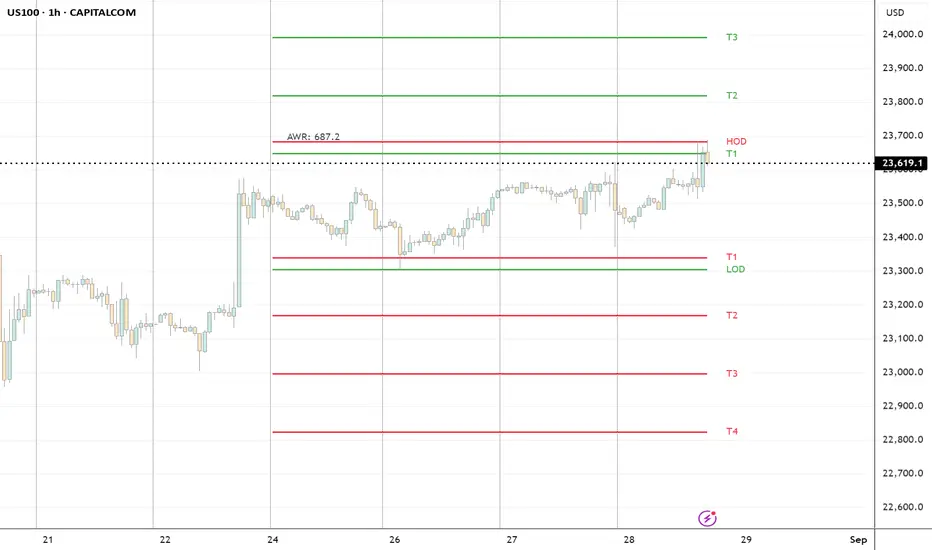
HTF Ranges - AWR/AMR/AYR [bilal]📊 Overview
Professional higher timeframe range indicator for swing and position traders. Calculate Average Weekly Range (AWR), Average Monthly Range (AMR), and Average Yearly Range (AYR) with precision projection levels.
✨ Key Features
📅 Three Timeframe Modes
AWR (Average Weekly Range): Weekly swing targets - Default 4 weeks
AMR (Average Monthly Range): Monthly position targets - Default 6 months
AYR (Average Yearly Range): Yearly extremes - Default 9 years
🎯 Dual Anchor Options
Period Open: Week/Month/Year opening price
RTH Open: First RTH session (09:30 NY) of the period
📐 Projection Levels
100% Range Levels: Upper and lower targets from anchor
Fractional Levels: 33% and 66% zones for partial targets
Custom Mirrored Levels: Set any percentage (0-200%) with automatic mirroring
Example: 25% shows both 25% and 75%
Example: 150% shows both 150% and -50%
📊 Information Table
Active range type (AWR/AMR/AYR)
Average range value for selected period
Current period range and percentage used
Distance remaining to targets (up/down)
Color-coded progress (green/orange/red)
🎨 Fully Customizable
Orange theme by default (differentiates from daily indicators)
Line colors, styles (solid/dashed/dotted), and widths
Toggle labels on/off
Adjustable lookback periods for each timeframe
Independent settings for each range type
⚡ Smart Features
Lines start at actual period open (not fixed lookback)
Automatically tracks current period high/low
Works on any chart timeframe
Real-time range tracking
Alert conditions when targets reached or exceeded
🎯 Use Cases
AWR (Weekly Ranges):
Swing trade targets (3-7 day holds)
Weekly support/resistance zones
Identify weekly trend vs rotation
Compare daily moves to weekly context
AMR (Monthly Ranges):
Position trade targets (2-4 week holds)
Monthly breakout levels
Institutional-level zones
Earnings play targets
AYR (Yearly Ranges):
Major reversal zones
Long-term support/resistance
Identify macro trend strength
Annual high/low projections
💡 Trading Strategies
AWR Strategy (Swing Trading):
Week opens near AWR lower level = potential long setup
Target AWR 66% and 100% levels
Week hits AWR upper in first 2 days = watch for reversal
Use fractional levels as scale-in/scale-out points
AMR Strategy (Position Trading):
Month opens near AMR extremes = fade setup
Month breaks AMR in week 1 = expansion (trend) month
Target opposite AMR extreme for swing positions
Use 33%/66% for partial profit taking
AYR Strategy (Long-term Context):
Price near AYR extremes = major reversal zones
Breaking AYR levels = historic moves (rare)
Use for macro trend confirmation
Great for yearly forecasting and planning
📊 Range Interpretation
<33% Range Used: Early in period, room for expansion
33-66% Range Used: Normal progression
66-100% Range Used: Extended, approaching extremes
>100% Range Used: Expansion period - trending or high volatility
⚙️ Settings Guide
Lookback Periods:
AWR: 4 weeks (standard) - adjust to 8-12 for smoother average
AMR: 6 months (standard) - seasonal patterns
AYR: 9 years (standard) - captures full cycles
Anchor Type:
Period Open: Use for clean week/month/year open reference
RTH Open: Use if you only trade day session, ignores overnight gaps
Custom Levels:
25% = quartile targets
75% = three-quarter targets
80% = "danger zone" for reversals
111% = extended breakout target
🔄 Combine with ADR Indicator
Run both indicators together for complete multi-timeframe analysis:
ADR for intraday precision
AWR/AMR/AYR for swing/position context
See if today's ADR move is significant in weekly/monthly context
Multi-timeframe confluence = highest probability setups
💼 Ideal For
Swing Traders: Use AWR for 3-10 day holds
Position Traders: Use AMR for 2-8 week holds
Long-term Investors: Use AYR for macro context
Index Futures Traders: ES, NQ, YM, RTY
Multi-timeframe Analysis: Combine with daily ADR

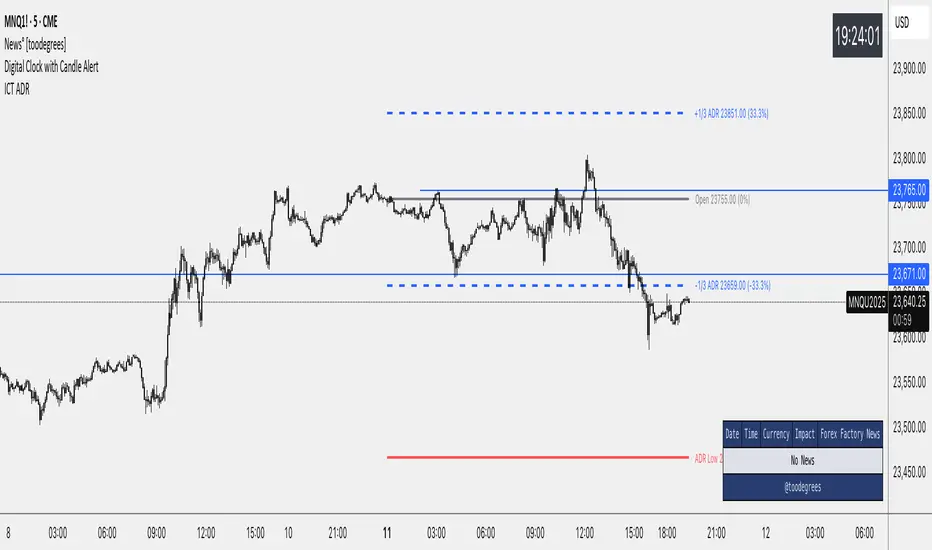
Advanced ICT ADR Projections [bilal]📊 Overview
Professional ADR indicator designed specifically for index futures traders. Calculate and visualize Average Daily Range with multiple session options, fractional levels, and higher timeframe context.
✨ Key Features
🎯 Multiple Session Types
Full Day: Standard calendar day calculation
Midnight: Anchored to 00:00 NY time open
RTH (Regular Trading Hours): 09:30-16:00 NY session
Custom: Define your own session hours and anchor point
📐 Projection Levels
100% ADR Levels: Upper and lower range targets from anchor
Fractional Levels: 33% and 66% zones for partial targets
Custom Mirrored Levels: Set any percentage (0-200%) with automatic mirroring
Example: 25% shows both 25% and 75%
Example: 111% shows both 111% and -11%
📅 Higher Timeframe Context (Optional)
AWR: Average Weekly Range overlay
AMR: Average Monthly Range overlay
AYR: Average Yearly Range overlay
All HTF ranges use same anchor as daily session
📊 Information Table
Current session type and anchor time
ADR value for selected period
Current range and percentage used
Distance remaining to ADR targets (up/down)
Color-coded range percentage (green/orange/red)
🎨 Fully Customizable
Line colors, styles (solid/dashed/dotted), and widths
Toggle labels on/off
Adjustable ADR lookback period (1-100 days)
All HTF periods customizable
⚡ Smart Features
Lines start at actual session open (not fixed lookback)
Works on any timeframe
Real-time range tracking
Alert conditions when ADR reached or exceeded
🎯 Use Cases
For Day Traders:
Set profit targets at ADR extremes
Identify range expansion vs rotation days
Know when you've used 75%+ of daily range (possible reversal)
Compare RTH vs full day ranges
For Swing Traders:
Use AWR/AMR for weekly/monthly targets
Understand if today's move is significant in weekly context
Multi-timeframe confluence
Risk Management:
Size positions based on % of ADR remaining
Avoid trading when ADR exhausted (>100%)
Better stop placement using fractional levels
💡 Trading Tips
<50% ADR used = Room to run (continuation trades)
50-75% ADR used = Getting extended (scale out)
75-100% ADR used = Near extremes (reversal setups)
>100% ADR = Expansion day (trend day or volatility spike)
Use fractional levels (33%, 66%) as:
Partial profit targets
Re-entry zones on pullbacks
Confluence with other support/resistance
Compare RTH vs Full Day ADR to see if overnight or day session drives volatility.
⚙️ Settings Guide
ADR Period: 5 days is standard, adjust for different market regimes
Session Types:
Use Midnight for crypto or 24hr markets
Use RTH for pure day session analysis
Use Custom for specific session times (London, Asia, etc.)
Custom Levels:
Set 25% for quartile levels
Set 111% for extended targets beyond ADR
Experiment with 50%, 75%, 80% for your strategy
Perfect for ES, NQ, YM, RTY futures traders who need precise intraday range analysis with higher timeframe context!

Average Daily Range [Blaz]Version 1.0 – Published October 2025: Initial release
1. Overview & Purpose
The Average Daily Range is an advanced volatility assessment tool designed to give traders a clear, real-time view of the market's expected daily movement. It calculates the average range between daily highs and lows over a user-defined historical period and projects this average onto the current trading session.
By visualising the potential high and low boundaries for the day, this indicator assists in setting realistic profit targets, managing risk effectively, and identifying when price action is becoming overextended relative to its recent volatility profile. It is an essential tool for day traders and swing traders across all markets, including Forex, Stocks, Crypto, Futures, and Commodities.
2. Core Functionality & Key Features
The indicator provides a dynamic, multi-faceted analysis of daily volatility:
Historical ADR Calculation: Automatically computes the Average Daily Range based on the specified number of previous trading days (configurable from 1 to 20).
Real-Time Range Tracking: Monitors and displays the current day's live price range as it develops.
Percentage Used Metric: Shows the percentage of the historical ADR that the current day's range has already consumed, providing an immediate gauge of remaining volatility potential.
Remaining Range Projection: Visually highlights the potential upward and downward movement remaining to meet the average range, displayed as semi-transparent areas on the chart.
Daily Open Reference: Plots customisable vertical separation lines and horizontal price lines at the daily open to clearly anchor the current session's price action.
3. Visual Components & Analytical Insights
A fully configured Average Daily Range setup displays several key analytical components that work together to provide a comprehensive volatility overview.
3.1. Information Table
A highly customizable data table provides a concise summary of all critical metrics at a glance:
Historical Ranges: Displays the individual daily ranges for the selected lookback period.
ADR Value: The calculated average range.
Today's Range: The live, developing range for the current session.
% Used: A colour-coded percentage (turning orange upon exceeding 100% and red upon exceeding 150%) showing how much of the average volatility has been consumed.
3.2. Visual Range Projections
Remaining Range Zones: When the current day's range is below the historical average, semi-transparent zones extend from the current day's extreme high and low, illustrating the additional movement required to reach the ADR. This provides an instant visual cue for potential target zones.
Daily Open Markers: Clean, customisable lines mark the start of each trading day (vertical line) and the daily open price (horizontal line), helping to contextualise intraday price moves.
4. Input Parameters and Settings
4.1. General Settings
Lookback: Set the number of days used to calculate the Average Daily Range (1-20).
Set Alert: Configure alerts to be notified when the current day's range consumes a significant portion (e.g., 100% or more) of the historical ADR.
4.2. Table Customization
Visibility & Style: Toggle the table and historical data on/off. Fully customise the header and body colours, text colours, border style, and font sizes.
Placement & Orientation: Precisely position the table anywhere on the chart (Top/Bottom/Centre, Left/Right) and choose between Horizontal or Vertical layout to best suit your chart layout.
4.3. Visual Style Controls
Remaining Range: Toggle the projection zones on/off and customise their colour and transparency.
Daily Open Markers: Independently control the visibility, colour, style, and width of the daily separation line and the open price line.
5. Protected Logic & Original Design
The Average Daily Range indicator incorporates proprietary logic for efficiently tracking intraday extremes, managing historical data arrays, and dynamically rendering visual elements. The closed-source nature of this tool protects the author's original code structure and optimisation techniques, particularly the real-time area fill projection logic for the remaining daily range and the dynamic table management system. This ensures the indicator remains performant and reliable while being freely accessible to the entire TradingView community.
6. Disclaimer & Terms of Use
This indicator, titled Average Daily Range , has been independently developed by the author. The code and its structural logic are original and were written entirely from scratch to reflect a unique and efficient approach to volatility analysis. The internal mechanics were written from scratch and are not based on any publicly available script or third-party code.
This tool is provided solely for educational and informational purposes. It is not intended as financial advice, investment guidance, or a specific recommendation to buy or sell any financial instrument. The indicator is designed to assist with technical analysis based on volatility but does not guarantee accuracy or profitability.
Trading financial markets involves significant risk, including the possibility of loss of capital. By using this indicator, you acknowledge and accept that you are solely responsible for any decisions you make and for all trading outcomes. No part of this script should be considered a signal or assurance of success in the market.

ADR H/L + Bull/Bear TargetsThis indicator calculates the Average Daily/Weekly Range over any given period and plots the Bull and Bear targets for that Session Daily/Weekly or both. Classic targets are calculated at ADR/AWR +/- .50 .75 1.00 1.25. Green is for the + and RED is for the - but colors can been changed to suit.
In 'Settings' there is the ability to toggle:
1. How many sessions you want to plotting on your chart.
2. Switching ON/OFF Bull/Bear targets.
3. Line color/thickness
4. Ability to offset Header for ADR/AWR vertically.
5. I've put in there a FIB option as well as Classic. FIB counts are at .382 .50 .618 1.00 of ADR and labelled as such.
ICT Average Daily Range (ADR)📊 ICT Average Daily Range (ADR) Indicator
This indicator implements the Average Daily Range (ADR) concept taught by ICT (Inner Circle Trader). It calculates the average range of previous trading days and projects key levels for the current session, helping traders identify high-probability targets and reversal zones.
━━━━━━━━━━━━━━━━━━━━━━━━━━━━━━━━━━━━━━━━
✨ KEY FEATURES
- Accurate ADR Calculation - Uses only completed trading sessions (excludes current incomplete day)
- ICT Judas Swing Levels - Highlights the critical 1/3 ADR levels where institutional manipulation often occurs
- Two Calculation Modes - New York Midnight (ICT recommended) or Classic Daily
- Customizable Fractional Levels - 1/3, 2/3, 25%, 50%, 75% of ADR
- Smart Labels - Display price levels and percentage from open
- Flexible Visual Style - Separate line styles for different level groups
- Session Dividers - Optional vertical lines at session start
━━━━━━━━━━━━━━━━━━━━━━━━━━━━━━━━━━━━━━━━
📅 WEEKEND SESSION HANDLING
How Forex Sessions Work:
- Monday-Thursday: Full 24-hour sessions
- Friday: Partial session (00:00 to ~17:00 NY time)
- Sunday: Partial session (~17:00 NY to Monday 00:00)
- Saturday: No trading
Impact on ADR:
Both Friday and Sunday are partial sessions which can lower your ADR average. For example: Mon-Thu average 100 pips, Fri 70 pips, Sun 30 pips = 5-day ADR of 80 pips.
Other Markets:
- Crypto: 24/7 trading, no partial days
- Futures/Stocks: No Sunday session
━━━━━━━━━━━━━━━━━━━━━━━━━━━━━━━━━━━━━━━━
🎓 ICT CONCEPTS
Average Daily Range (ADR)
Statistical measure of average price movement per day. Acts as a "magnet" for price - markets tend to fulfill their ADR.
1/3 ADR Levels - "Judas Swing"
ICT's signature concept for identifying manipulation zones. Price often sweeps these levels to trap retail traders before reversing. High-probability reversal areas during London/NY sessions.
━━━━━━━━━━━━━━━━━━━━━━━━━━━━━━━━━━━━━━━━
⚙️ SETTINGS GUIDE
ADR Period: Number of days for calculation (default 5)
- Lower values = More responsive
- Higher values = Smoother levels
Calculation Mode:
- New York Midnight - ICT standard, best for Forex
- Classic Daily - Exchange timezone
Level Display:
- ADR High/Low - Primary targets
- 1/3 Levels - Judas Swing zones
- 2/3 Levels - Trending day targets
- Quarter Levels - 25% and 75%
- 50% Level - Mid-range
Visual Options:
- Separate line styles for each level group
- Customizable colors and width
- Optional labels with price/percentage
━━━━━━━━━━━━━━━━━━━━━━━━━━━━━━━━━━━━━━━━
💡 TRADING TIPS
1. Early Session: If price moves to 1/3 ADR quickly, watch for Judas Swing reversal
2. Mid Session: Use 2/3 levels as continuation targets in trending markets
3. Late Session: ADR completion often marks session extremes
4. Risk Management: Use fractional levels for scaling positions
5. Confluence: Combine with Fair Value Gaps, Order Blocks, and Liquidity Pools
Best Timeframes: 15m, 30m, 1H, 4H for intraday trading
━━━━━━━━━━━━━━━━━━━━━━━━━━━━━━━━━━━━━━━━
📝 NOTES
- Based on concepts taught by ICT (Inner Circle Trader)
- Requires at least 5 completed sessions for full accuracy
- ICT suggested using "New York Midnight" mode
- Weekend sessions handled based on actual market hours
- Be aware that Friday/Sunday partial sessions may lower ADR average
Created with focus on clean implementation and ICT's core teachings.
[Stop!Loss] ADR Signal ADR Signal - a technical indicator located in a separate window, which displays by default the 80%-level , as well as the 100%-level of the average daily range (ADR) for the last 10 days and compares it with the current intraday range. The indicator helps not only with the use of a mathematical-statistical method to identify a potential reversal at the moment during intraday trading, but can also serves as an effective assistant in risk management.
👉 Basic mechanics of the indicator
Firstly, this indicator tracks the performance of the standard ATR indicator on the daily chart, in other words, ADR (Average Daily Range).
Important ❗️The ATR (Average True Range) indicator was created by J. Welles Wilder Jr. He first introduced ATR in his book "New Concepts in Technical Trading Systems", published in 1978. Wilder developed this indicator to measure market volatility to help traders estimate the range of price movements. This indicator is built into TradingView, more details can be found by link: www.tradingview.com
Like ATR , ADR calculates the average true range for a specified period. In this case, the distance in points from the maximum of each day to its minimum is calculated, after which the arithmetic mean is calculated - this is ADR .
👉 Visualization
ADR Signal is located in a separate window on the chart and has 3 levels:
1) "ADR level" (green line) - the same parameter, the calculations of which are briefly described above. There is 100%-level of ATR on the daily chart (ADR).
2) "Current level" (red line) - this is the current price passage within the day, calculated in points. At the start of a new day, this parameter is reset. Therefore, in the indicator window, this line has sharp drops at the start of a new trading day: "A new trading day - the instrument's power reserve is renewed again".
3) "Signal level" (blue line) - this is an individually customized value that demonstrates a certain part of the ADR parameter.
👉 Inputs
1) - is responsible for the ATR indicator period, the value of which will always be calculated on the daily chart. The default value is "10", that is, ATR is calculated for the last 10 days (not including the current one).
2) - signal level (in %). The default value is "0.8", that is, 80%-level of the ADR parameter (set earlier) is calculated.
👉 Style
1) - by default, this level is colored "blue".
2) - by default, this level is colored "red".
3) - by default, this level is colored "green".
👉 How to use this indicator
Important❗️ The two methods of the use of the ADR Signal indicator described below will be most effective when trading intraday (which is highlighted quite well below), so it is more logical to use the indicator information on time periods H1 and below.
1) Identifying potential reversals during intraday trading:
The ADR Signal indicator can be used as a potential individual reversal strategy.
Important ❗️It should be noted that using it in it without additional confirming analysis tools will be a rather aggressive trading approach. Therefore, it is best to support the entry point in particular with other methods.
In this case, the crossing of the red line (the number of points passed within the current day, that is, from the minimum of the current day to its maximum) and the blue line (color of the Signal level based on the default settings), indicates that the trading instrument has passed 80% (based on the default settings for the "Signal level") of its average distance from the maximum to the minimum over the past 10 days (based on the default settings for the "ADR Length"). Such a situation in the context of the mathematical-statistical approach indicates a probable reversal, since the "power reserve" of this instrument is mostly exhausted, so one can expect with a higher probability, at least, a price stop and possibly a reversal. In case of crossing of the red line and the green one (ADR level), it says again that based on the mathematical-statistical approach, this trading instrument has completely exhausted its intraday "power reserve". In this situation, a stop or reversal of the price will be even more likely.
Of course, using the "Signal level" parameter, one can filter out even more reliable situations for potential price reversals within a day, namely, by specifying, for example, 1.5 in the field of this parameter. Under such conditions, in the case of crossing the red and blue lines (based on the default style settings), to say that the trading instrument has passed 150% of its average distance over the last 10 days (based on the default style settings "ADR length"). In this case, the probability of a stop or reversal of the price increases even more.
2) Use in risk management:
In terms of risk management, this indicator is more applicable to open trades. For example, if one had an open Buy-position (especially if it is an intraday trade) and the price has raised significantly during the day, then the crossing of the red line with the blue line , and especially the red line with the green line , may indicate that the price will most likely stop growing, since the "power reserve" is almost or completely exhausted for this instrument within the current day. In this case, one can, at a minimum, move the trade to breakeven or even partially fix the profit.
We will continue to discuss the methods of using this indicator and strategies based on it here. And we are always waiting for your reactions and feedback on this topic 💬.
Thank you for your support 🚀

Average Daily Range ProjectionsCreates a trailing high and low projection based on the Average Daily Range.
Track the Session High and Low to determine the Daily Range.
Average the Daily Range by a fixed Period to create an Average Daily Range .
Track the Prior Daily Range .
Track the Current Daily Range .
Track the % of Range completion relative to the CDR & ADR(P).
From the Session Low, project an Average Daily Range High by adding the ADR.
From the Session High, project an Average Daily Range Low by subtracting the ADR.
When %R reaches 100% or greater, the ADR HI & LO will lock, showing the range break out or break down. As the Session High and Low create the Daily Range, observe the reaction of price as it reaches the limit of the expected daily range.
On strongly trending days, CDR is likely greater than PDR and ADR(P). Price can break away.
On ranging days, %R may fail to reach 100% and CDR may be lesser than PDR and ADR(P). Price can bounce around within the bounds of ADR HI & LO.

CoffeeShopCrytpo Dynamic PPIIn the financial world, the Producer Price Index (PPI) is often used to measure how domestic products are performing over time, indicating the health of the market. Domestic products refer to goods and services that are produced within a specific country’s borders. However, in this indicator, we’ve taken that idea and applied it directly to financial assets, allowing traders to see how an asset is performing relative to its own base value over a given period of time.
Here, the asset’s base value is represented as 100%. When the asset performs above 100%, it's considered to be in a buyer's market—indicating strength and demand. Conversely, if the value dips below 100%, it's operating below its base value, signaling a potential seller's market.
Why This Matters:
This indicator not only converts an asset’s performance into a PPI-style calculation, but it also visualizes price movements as price candles. This dual perspective is crucial, because even if the asset’s performance is over 100%, the closing price might still fall below that threshold—adding nuance to your understanding of market conditions.
Key Features of the Indicator:
Bullish and Bearish Convergence Levels: These levels show whether the market leans bullish or bearish. If the Bullish Convergence level is higher than the Bearish one, the market is bullish, and vice versa. Importantly, these levels can signal shifts in market strength, regardless of where the PPI candles are positioned.
If Bullish Convergence is rising below Bearish, the bearish market is weakening and bullish pressure is growing. Conversely, if Bearish Convergence is falling above Bullish, the bearish side is losing ground.
Market Strength Visualizations:
Strong Bullish Market: Bullish Convergence is higher than Bearish, and it’s still rising.
Strong Bearish Market: Bearish Convergence is above Bullish, and it's climbing.
Weak Bullish Market: Bullish Convergence is above Bearish, but the PPI closes below Bullish Convergence.
Weak Bearish Market: Bearish Convergence is above Bullish, but the PPI closes above Bullish Convergence
Pullbacks:
Bullish Pullback: In a strong bullish market, the PPI shows lower closes below the Bullish Convergence.
Bearish Pullback: In a strong bearish market, the PPI shows higher closes above the Bullish Convergence.
Divergences:
Higher Price, Lower or Flat PPI: This indicates that while the asset’s price is rising, its underlying performance (relative to the PPI’s 100% base level) is not keeping up. Essentially, the asset is reaching new price highs, but its strength or "efficiency" of growth is weakening.
The PPI is designed to show the "return" of an asset's performance relative to its historical movement, so when it lags behind price, it suggests that the price rise may not be sustainable.
When you observe the first high of the PPI level above the bullish convergence level, followed by a second high of the PPI below the bullish convergence level in a bullish market, this creates a divergence.
Example of Divergence in image:
1. First High of PPI Above the Bullish Convergence Level:
This suggests strong bullish momentum. The asset’s performance, as measured by the PPI, is in line with or even outperforming price expectations, indicating the market is experiencing a robust bullish trend. The fact that the PPI level is above the bullish convergence line means that the asset is operating well above its base performance (above 100%) and bullish momentum is clearly dominant.
2. Second High of PPI Below the Bullish Convergence Level:
This marks a potential weakening of the bullish momentum. Although the market is still in a bullish state (since bullish convergence remains above bearish), the PPI failing to reach the bullish convergence level suggests that the asset’s performance is not keeping pace with price action or is underperforming relative to its earlier high.
The fact that this occurs while the market is still bullish (bullish convergence is greater than bearish) can signal a possible pullback or a temporary consolidation phase within the larger bullish trend.
What does a divergence mean:
Momentum Weakening: The second high of the PPI being below the bullish convergence line suggests that while prices may still be increasing, the strength behind the move is fading. The asset is not performing as strongly as it did during the first high, and the market’s confidence or momentum might be softening.
Potential Bullish Pullback: This could indicate that a pullback or correction within the larger bullish trend is underway. Traders might be taking profits, or buyers could be losing enthusiasm, causing the asset to stall temporarily. However, because the overall market remains bullish, this doesn’t necessarily mean a full reversal—just a cooling off period.
Caution in New Long Positions: If you see this divergence, it could be a sign to be more cautious about opening new long positions. It suggests that the asset may need to consolidate or correct before resuming its upward trend, and it’s worth waiting for confirmation of renewed momentum before jumping back in.
ATR Settings
Youll notice there are two ATR settings. One for short term and one for long term.
These values are based on your preferential strategy for what you consider to be long and short term.
The final ATR values are calculated against eachother and applied to the Volatility Label at the end of price.
This label shows you the current ATR as well as the previous candle ATR.
Why this is important:
If the short term ATR is greater than the long term ATR, then volatility is rising in the short term greater than the long term.
This gives your label a value greater than 1.0. This means the short term trend is about to move.
If the long term ATR is greater than the short term ATR, there is no volatility in the short term and only long term exists.
This gives you a value of less than 1.0. This means no volatility or ranging market in the short term.

Average Session Range [QuantVue]The Average Session Range or ASR is a tool designed to find the average range of a user defined session over a user defined lookback period.
Not only is this indicator is useful for understanding volatility and price movement tendencies within sessions, but it also plots dynamic support and resistance levels based on the ASR.
The average session range is calculated over a specific period (default 14 sessions) by averaging the range (high - low) for each session.
Knowing what the ASR is allows the user to determine if current price action is normal or abnormal.
When a new session begins, potential support and resistance levels are calculated by breaking the ASR into quartiles which are then added and subtracted from the sessions opening price.
The indicator also shows an ASR label so traders can know what the ASR is in terms of dollars.
Session Time Configuration:
The indicator allows users to define the session time, with default timing set from 13:00 to 22:00.
ASR Calculation:
The ASR is calculated over a specified period (default 14 sessions) by averaging the range (high - low) of each session.
Various levels based on the ASR are computed: 0.25 ASR, 0.5 ASR, 0.75 ASR, 1 ASR, 1.25 ASR, 1.5 ASR, 1.75 ASR, and 2 ASR.
Visual Representation:
The indicator plots lines on the chart representing different ASR levels.
Customize the visibility, color, width, and style (Solid, Dashed, Dotted) of these lines for better visualization.
Labels for these lines can also be displayed, with customizable positions and text properties.
Give this indicator a BOOST and COMMENT your thoughts!
We hope you enjoy.
Cheers!

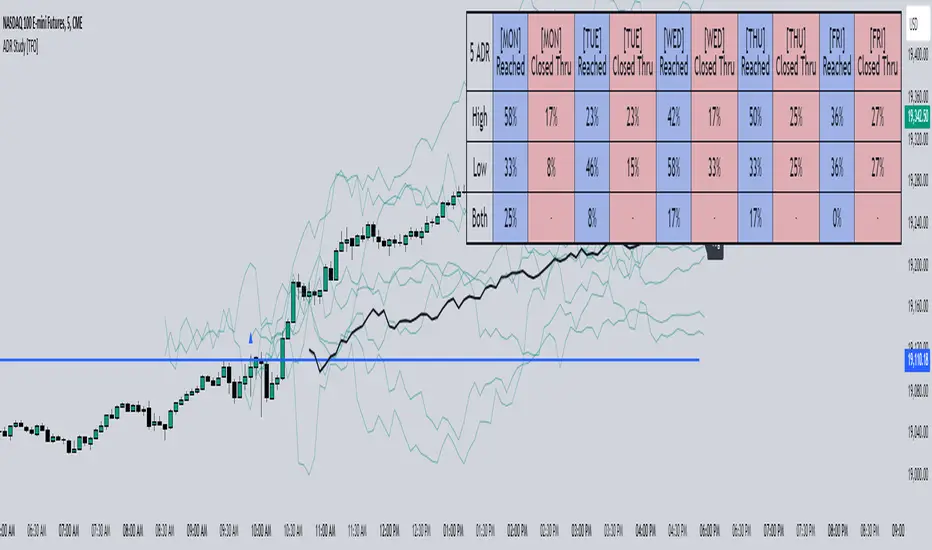
ADR Study [TFO]This indicator is focused on the Average Daily Range (ADR), with the goal of collecting data to show how often price reaches/closes through these levels, as well as a look at historical moves that reached ADR and at similar times of day to study how price moved for the remainder of the session.
The ADR here (blue line) is calculated using the difference between a day's highest and lowest points. If our ADR length is 5, then we are taking this difference from the last 5 days and averaging them together. At the following day's open, we take half of this average and plot it above and below the daily opening price to place theoretical limits on how far price may move according to the lookback period. The triangles indicate when price has reached ADR (either +ADR or -ADR), and alerts can be created for these events.
The Scale Factor is an optional parameter to scale the ADR by a certain amount. If set to 2 for example, then the ADR would be 2x the average daily range. This value will be reflected in the statistics options so that users can see how different values affect the outcomes.
Show Table will display data collected on how often price reaches these levels, and how often price closes through them, for each day of the week. By default, these are colored as blue and red, respectively. From the following chart of NQ1!, we can see for example that on Mondays, price reached +ADR 38% of the time and closed through it 23% of the time. Note that the statistics for closing through the ADR levels are derived from all instances, not just those that reached ADR.
Show Sample Sizes will display how many instances were collected for all given sets of data. Referring to the same example of NQ1!, we can see that this particular chart has collected data from 109 Mondays. From those Mondays, 41 reached +ADR (38%, verifying our initial claim) and 25 closed through it (23%). This is important to understand the scope of the data that we're working with, as percentages can be misleading for smaller sample sizes.
Show Histogram will plot the same exact data as the table, just in a histogram form to visually emphasize the differences on a day-by-day basis. On this chart of RTY1!, we can see for example from the top histogram that on Wednesdays, 40% reached +ADR and only 22% closed through it. Similarly if we look at the bottom histogram, we can see that Wednesdays reached -ADR 46% of the time and closed through it only 28% of the time.
We can also use Show Sample Sizes to display the same information that would be in the table, showing how many instances were collected for each event. In this case we can see that we observed 175 Fridays, where 76 reached +ADR (43%) and 44 closed above it (25%).
Show Historical Moves is an interesting feature of this script. When enabled, if price has reached +/- ADR in the current session, the indicator will plot the evolution of the close prices from all past sessions that reached +/- ADR to see how they traded for the remainder of the session. These calculations are made with respect to the ADR range at the time that price traded through these levels.
Historical Proximity (Bars) allows the user to observe historical moves where price reached ADR within this many bars of the current session (assuming price has reached an ADR level in the current session). In the above chart, this is set to 1000 so that we can observe each and every instance where price reached an ADR level. However, we can refine this a bit more.
By limiting the Historical Proximity to something like 20, we are only considering historical moves that reached ADR within 20 bars of todays +ADR reach (9:50 am EST, noted by the blue triangle up). We can enable Show Average Move to display the average move by the filtered dataset, and Match +/-ADR to only observe moves inline with the current day's price action (in this case, only moves that reached +ADR, since price has not reached -ADR).
We can add one more filter to this data with the setting Only Show Days That: closed through ADR; closed within ADR; or either. The option either is what you see above, as we are considering both days that closed through ADR and days that closed within it (note that in this case, closing within ADR simply means that price reached +ADR and closed the day below it, and vice versa for -ADR; this does not mean that price must have closed in between +ADR and -ADR). If we set this to only show instances that closed within ADR, we see the following data.
Alternatively, we can choose to Only Show Days That closed through ADR, where we would see the following data. In this case, the average move very much resembles the price action that occurred on this particular day. This is in no way guaranteed, but it makes an interesting case for how we could use this data in our analysis by observing similar, historical price action.
Please note that this data will change over time on a rolling basis due to TradingView's bar lookback, and that for this same reason, lower timeframes will yield less data than larger timeframes.
ADR % RangesThis indicator is designed to visually represent percentage lines from the open of the day. The % amount is determined by X amount of the last days to create an average...or Average Daily Range (ADR).
1. ADR Percentage Lines: The core function of the script is to apply lines to the chart that represent specific percentage changes from the daily open. It first calculates the average over X amount of days and then displays two lines that are 1/3rd of that average. One line goes above the other line goes below. The other two lines are the full "range" of the average. These lines can act as boundaries or targets to know how an asset has moved recently. *Past performance is not indicative of current or future results.
The calculation for ADR is:
Step 1. Calculate Today's Range = DailyHigh - DailyLow
Step 2. Store this average after the day has completed
Step 3. Sum all day's ranges
Step 4. Divide by total number of days
Step 5. Draw on chart
2. Customizable Inputs: Users have the flexibility to customize the script through various inputs. This includes the option to display lines only for the current trading day (`todayonly`), and to select which lines are displayed. The user can also opt to show a table the displays the total range of previous days and the average range of those previous days.
3. No Secondary Timeframe: The ADR is computed based on whatever timeframe the chart is and does not reference secondary periods. Therefore the script cannot be used on charts greater than daily.
This script is can be used by all traders for any market. The trader might have to adjust the "X" number of days back to compute a historical average. Maybe they only want to know the average over the past week (5 days) or maybe the past month (20 days).

Average Range PercentageIt is indicator for average percent range (range from high to low of stock/index price) of N days,
This will help to find high percentage moving stock/index for intraday.

Average Range @coldbrewroshTaking the average daily range from low to high or high to low isn't the "best" way to get an idea of how much to set targets. So, I made this indicator to make the system better.
This indicator calculates the daily range from Open to High on Bullish Days & Open to Low on Bearish Days .
Nobody can catch the absolute low of the day on bullish days and get out at the high but one can enter at a reasonable price around the open ( 17:00 EST ) .
To complement the Average Range, another table shows the movement in the opposite direction.
For Instance: On Bullish Days how much it moved from Open to Low so that we have an idea of where to put the stop loss and vice versa. The time ranges calculated are the last 5 days, last 1 month, last 3 months & last 1 year.
Note #1: Even though the date range is predefined, it has a different meaning. For Instance: date range of last 5 days means "calculation of the range of last 5 bullish daily candles & not last 5 days" .
Note #2: Exclusive to Forex at the time of posting this.

Average Daily Range (ADR) (Multi Timeframe, Multi Period)Average Daily Range (ADR)
(Multi Timeframe, Multi Period, Extended Levels)
Tips
• Narrow Zones are an indication of breakouts. It can be a very tight range as well.
• Wider Zones can be Sideways or Volatile.
What is this Indicator?
• This is Average Daily Range (ADR) Zones or Pivots.
• This have Multi Timeframe, Multi Period (Up to 3 Levels) and Extended Target Levels.
Advantages of this Indicator
• This is a Leading indicator, not Dynamic or Repaint.
• Helps to identify the reversal points.
• The levels are more accurate and not like the old formulas.
• Can practically follow the Buy Low and Sell High principle.
• Helps to keep minimum Stop Loss.
Who to use?
• Highly beneficial for Day Traders
• It can be used for Swing and Positions as well.
What timeframe to use?
• Any timeframe.
When to use?
• Any market conditions.
How to use?
Entry
• Long entry when the Price reach at or closer to the Green Support zone.
• Long entry when the Price retrace to the Red Resistance zone.
• Short entry when the Price reach at or closer to the Red Resistance zone.
• Short entry when the Price retrace to the Green Support zone.
• Long or Short at the Pivot line.
Exit
• Use past ADR levels as targets.
• Or use the Target levels in the indicator for breakouts.
• Use the Pivot line as target.
• Use Support or Resistance Zones as targets in reversal method.
What are the Lines?
Gray Line:
• It the day Open or can be considered as Pivot.
Red & Green ADR Zones:
• Red Zone is Resistance.
• Green Zone is Support.
• Mostly price can reverse from this Zones.
• Multiple Red and Green Lines forms a Zone.
• These lines are average levels of past days which helps to figure out the maximum and minimum price range that can be moved in that day.
• The default number of days are 5, 7 and 14. This can be customized.
Red & Green Target Lines:
• These are Target levels.
What are the Labels?
• First Number: Price of that level.
• Numbers in (): Percentage change and Change of price from LTP (Last Traded Price) to that Level.
General Tips
• It is good if Stock trend is same as that of the Index trend.
• Lots of indicators creates lots of confusion.
• Keep the chart simple and clean.
• Buy Low and Sell High.
• Master averages or 50%.

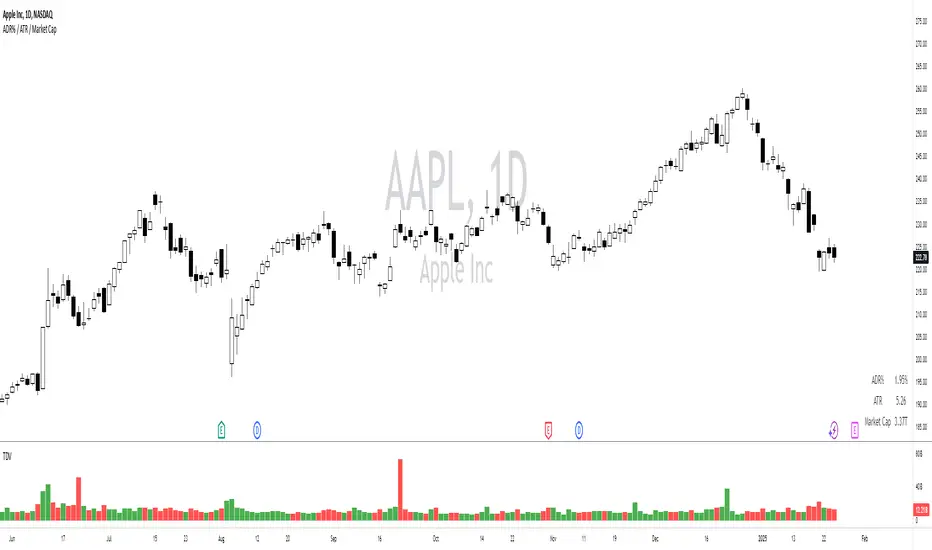
ADR% / ATR / Market CapDisplays the following values in a table in the upper right corner of the chart:
ADR%: Average daily range (in percent).
ATR: Average true range (hidden by default).
Market Cap: Total value of all a company's shares of stock.
All values are calculated based on daily bars, no matter what time frame you are currently viewing. Doesn't work for time frames >1D, which is why the table is not shown on weekly/monthly charts.
Credit to MikeC / TheScrutiniser and GlinckEastwoot for ADR% formula, and ArmerSchlucker for the original script which includes LoD Dist . instead of Market Cap.
Average, Median, Mode, Biggest: Pip Range Measures & LabelsApply various simple statistical measures to series of full candle ranges over user input length (in bars).
Choose between AVERAGE, MEDIAN, MODE, BIGGEST.
All calculations derive from the high-low range of a candle.
Default length = 260, the number of daily candles in a year.
MODE is calculated from pip ranges rounded to reasonable increments (to nearest 10pips foreign currencies; to nearest 100 pips for DXY ; nearest $10 for other assets). Best only use MODE for the major FX pairs encoded, and on Daily timeframe .
User input 'unit multiplier' only applies when asset is NOT a major Forex pair (unit and multiplier is auto applied for for major FX pairs).
© twingall
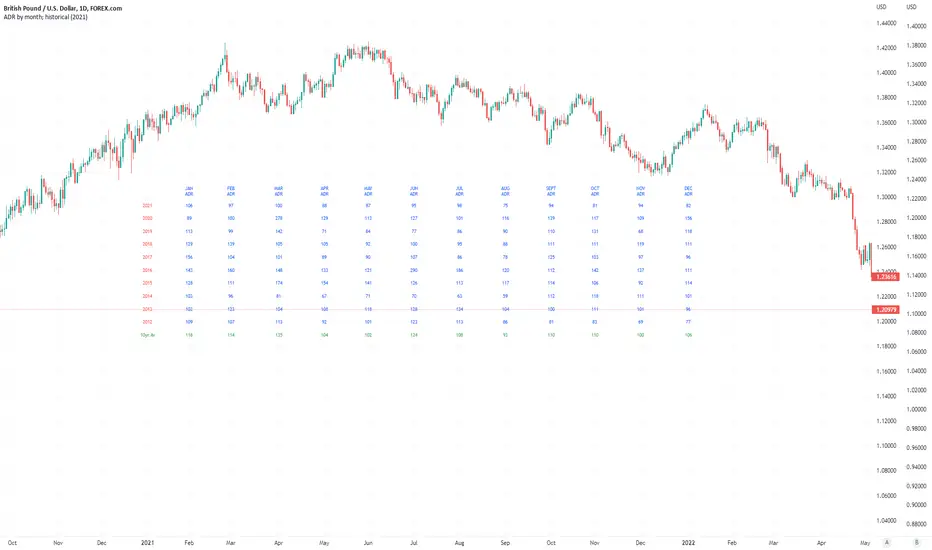
Average Daily Pip Ranges by monthShows historical average daily pip ranges for specific months for FOREX pairs
useful for guaging typical seasonal volatility; or rough expected daily pip ranges for different months
works on both DXY and foreign currencies
option to plot 10yrs worth of data; with 10yr average of the average daily range for specific months
cast back to any previous 10yrs of your choosing
@twingall
ADR - Average Daily Range With ForecastI always liked the MT4 ADR indicator that was going around but never found a decent port of it in tradingview. I also noticed that the way most people were doing the ADR calculation using SMA was not always accurate and that bothered me so I decided to write one from scratch which gave a very specific ADR calculation.
On the MT4 version it would project ADR targets on the high and low side. While I liked that I thought it could be improved upon by determining orderflow and anchoring to the perceived low of day to give you a more realistic target.
I also included a percentage of current ADR as well as changed the color to red once ADR was hit.
Configuring is very simple:
Max Timeframe To Display: you can set what timeframes to show adr (I know tradeingview lets you set this now but I still like it here)
Display Average Range As FOREX pips: Some Instruments use whole numbers so you can toggle if you need too
ADR Length Parameter: Sets Number of Days Lookback to Calculate ADR
I hope you enjoy it.

ADR PercentUses past 5 day's daily average ranges and calculates average ADR percentage with respect to latest day's open
Acknowledgement - Uses code from another excellent indicator from critian.d

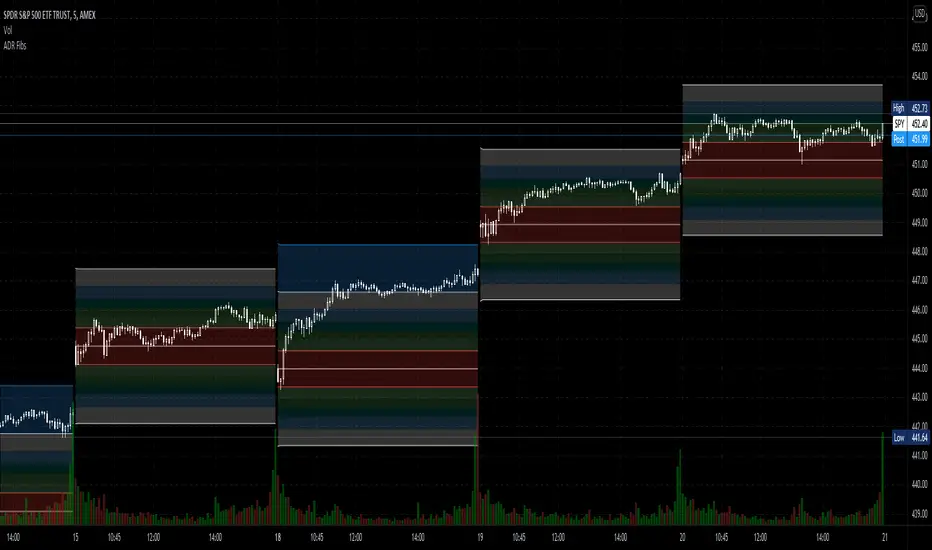
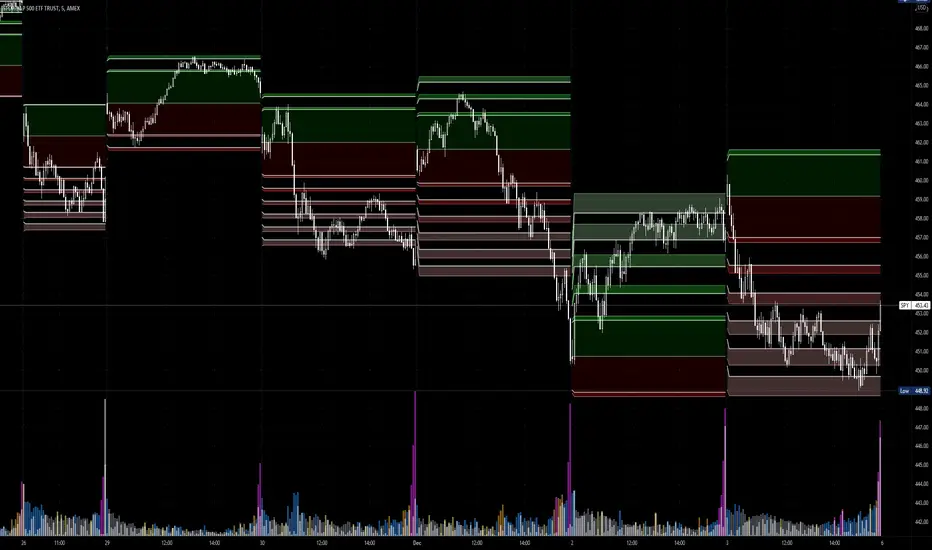
Average Daily Range Fibonacci LevelsThe Average Daily Range is a simple concept, calculated as the difference between daily highs and lows averaged over some period. This indicator uses that range in conjunction with Fibonacci ratios to create zones centered on the day's open that tends to act as areas of support and resistance.
The thicker White lines are the ADR levels; all other lines are the same value adjusted by the various Fibonacci values.
A simpler version of this concept can be seen in my other script, Average Daily Range Zones, which does not include the Fibonacci ratio zones.
Thanks to @Hank Hill for the original idea and TV for the feedback and support on the use of the security() function.
Also thanks to @GoldenCross for the Fibonacci obsession.
Average Daily Range ZonesThe Average Daily Range is a simple concept, calculated as the difference between daily highs and lows averaged over some period. This range is is overlaid and centered on the day's open, and tends to act as areas of support and resistance . This indicator provides two aggregation periods, creating a range that represents volatility in the ADR; a wider spread indicates greater recent volatility , and vice-versa.
Thanks to @Hank Hill for the original idea and ToS script this is based on, and TV for the feedback and support on the use of the security() function.
ADR% / ATR / LoD dist. TableDisplays the following values in a table in the upper right corner of the chart:
ADR%: Average daily range (in percent).
ATR: Average true range (hidden by default).
LoD dist.: Distance of current price to low of the day as a percentage of ATR.
All values are calculated based on daily bars, no matter what time frame you are currently viewing. Doesn't work for time frames >1D, which is why the table is not shown on weekly/monthly charts.
Credit to MikeC / TheScrutiniser and GlinckEastwoot for ADR% formula
