Average True Range 3MAClassic ATR (average true range) with triple MA (instead of default simple MA). Specially designed for options volatility management.Indicateur Pine Script®par Lever_Lab29
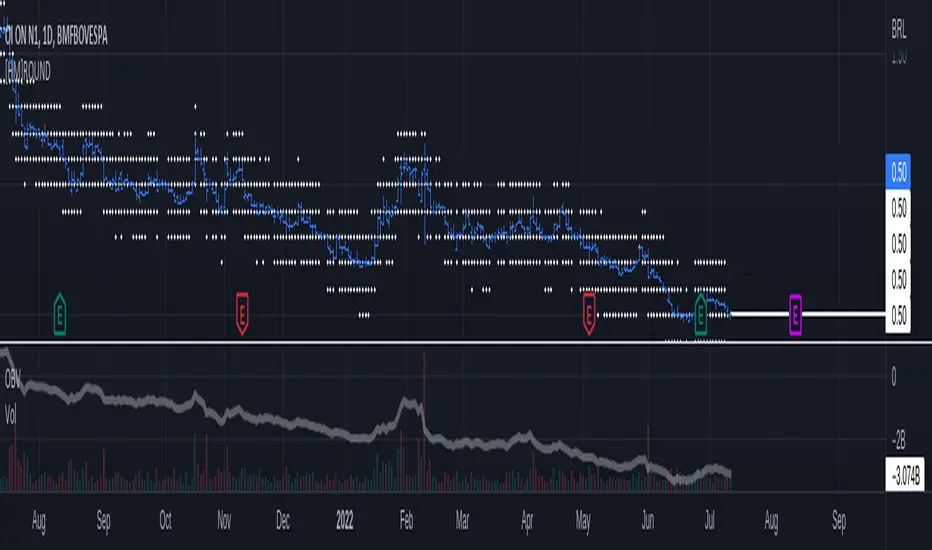
[HM] HORIZONTAL GRID ROUNDED (VOLATILITY BASED)The purpose of this indicator is to draw a horizontal grid having in mind: - rounded price levels instead tradingview standard grid, zoom-based; - calculated by volatility, using daily ATR; - independent of timeframe in use, locked to DAILY calculations. Further improvements are intended. Wish this could be useful. Any questions, feel free to comment. Indicateur Pine Script®par HelionMelionMis à jour 88184
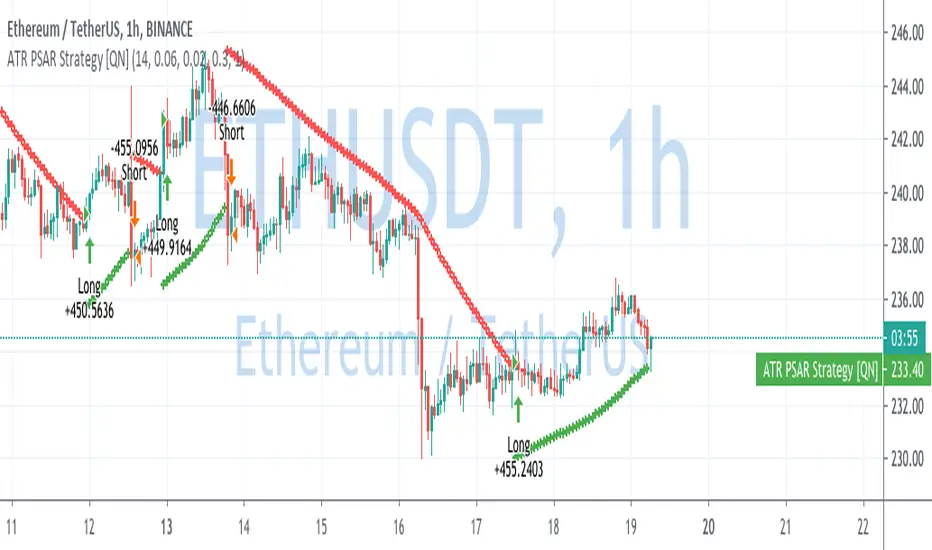
ATR Parabolic SAR Strategy [QuantNomad]I created a version of Parabolic SAR when I accelerate it not based on the difference from the extreme point but based on current ATR. So the idea is that for a more volatile market it should move faster. Performance is calculated based on 25% equity invested and 0.1% commission. What do you think about it? Does it make sense to do something like that? Do you have in mind other ways I can accelerate it when the market starts to be more volatile? Disclaimer Please remember that past performance may not be indicative of future results. Due to various factors, including changing market conditions, the strategy may no longer perform as good as in historical backtesting. This post and the script don’t provide any financial advice.Stratégie Pine Script®par QuantNomad2222 1.7 K
Moving Average ChannelThis indicator will use a moving average to create the channel around the price. It has some settings Display Settings Here it's possible to select what the indicator will display, from the middle line to the 3rd band level. Reversion points will appear when the price cross out the selected band Swing back option, when active, will make the indicator display the points when the price cross in the selected band Moving Averages Settings Here it's possible to select the moving averages settings that will be the basis for the channel calculation. There are ten moving averages types t be selected, each one will give different entry points Level Settings Each level will apply the value on the moving average to get the level bands. All default numbers are from the Fibonacci sequence When the extra filter is market, the indicator will display the crosses from the price and the selected band and also check if the candle closes in or out the bands. That filter will check for a possible rejection of the price, providing more accurate movement indications, but fewer signals Risk Management In this part, it's possible to display stop loss and target profit levels based on the ATR indicator. It's possible to select the multiplicator of the ATR to be applied on those levelsIndicateur Pine Script®par ThiagoSchmitzMis à jour 77879
MultiType Shifting Predictive Moving Averages (MA) CrossoverJust 2 Moving Averages with adjustable settings and shifting capability, plus signals and predicting continuations. At the time of publish these different types of MAs are supported: - SMA (Simple) - EMA (Exponential) - DEMA (Double Exponential) - TEMA (Triple Exponential) - RMA (Adjusted Exponential) - WMA (Weighted) - VWMA (Volume Weighted) - SWMA (Symmetrically Weighted) - HMA (Hull) I'm looking forward to any idea about filtering the signals. Thanks.Indicateur Pine Script®par informanerdMis à jour 2626701
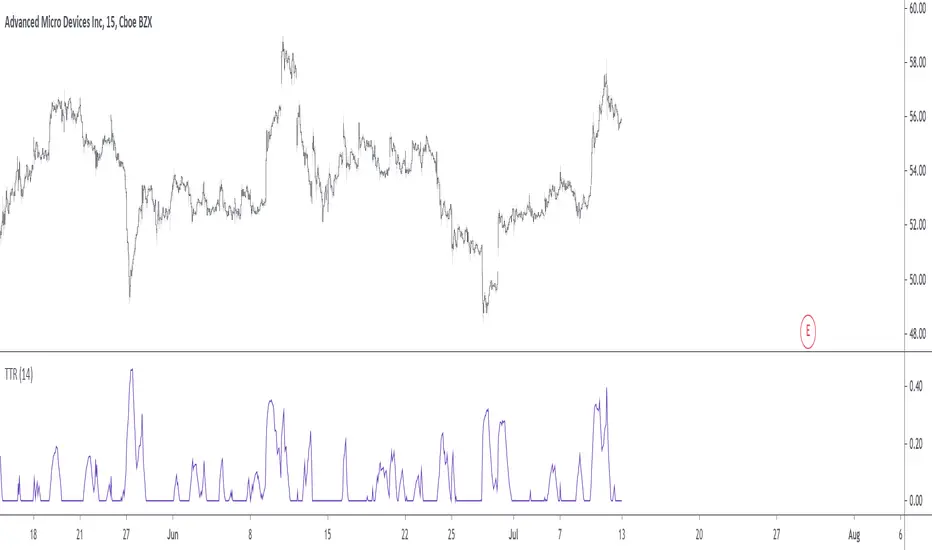
Trending True RangeDisplay a smoothed true range during trending markets, thus filtering any measurement occurring during ranging markets. Whether the market is trending or ranging is determined by the position of the efficiency ratio relative to its Wilder moving average. Settings Resolution : resolution of the indicator Length : period of the efficiency ratio and the Wilder moving averages used in the script Usage If you are not interested in volatility during ranging markets, this indicator might result useful to you. An interesting aspect is that it both measures volatility, but also determine whether the market is trending or ranging, with a zero value indicating a ranging market. Indicator against Atr, with both length = 14, our indicator might be easier to interpret. Note Thx to my twitter followers for their suggestions regarding this indicator. I apologize if it's a bit short, the original code was longer and included more options, but forcing a script to be lengthy is a really bad idea, so I stayed with something less flashy but certainly more practical, "classic Grover" some might say. Thx for reading! Indicateur Pine Script®par alexgrover1717409
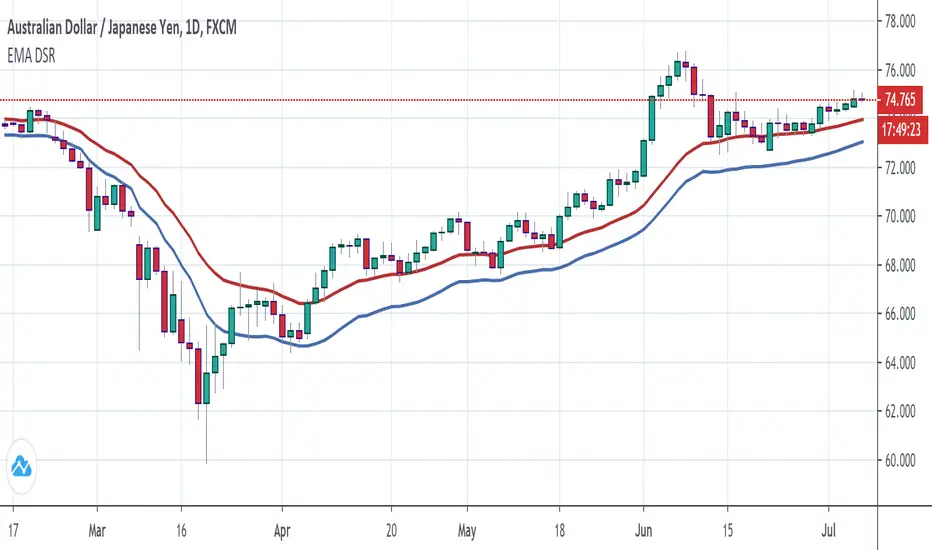
EMA Dynamic Support/ResistanceSupport/Resistance based on EMA and ATRIndicateur Pine Script®par cjhuay442
Triple Average True Range Channel Definition: By ADAM HAYES from Investopedia -- Updated Jul 8, 2019 The average true range (ATR) is a technical analysis indicator that measures market volatility by decomposing the entire range of an asset price for that period. Specifically, ATR is a measure of volatility introduced by market technician J. Welles Wilder Jr. in his book, "New Concepts in Technical Trading Systems." The true range indicator is taken as the greatest of the following: current high less the current low; the absolute value of the current high less the previous close; and the absolute value of the current low less the previous close. The average true range is then a moving average, generally using 14 days, of the true ranges. I've added a channel perspective from a certain % from the Slow Average Length that user will have to configure depending of resolution and the markets instruments they chose... Also a fill is used to easily point out when a high distance between a fast and a slow volatility analysis is occurring. Which is also denotated with a shaped label... Share and comment my work :) Indicateur Pine Script®par RVD-ProjectsMis à jour 70
RSI Pullback Trend Trading Indicator (LONG Only)***Use at your own risk*** ***This is for testing and education only*** I suggest that you also manually add the RSI(5,3,3) on your main chart for analysis. You can change the settings, but these are the defaults: Default Main Timeframe = Daily Default Secondary TimeFrame = Weekly (use around 5X your main timeframe, to check the longer term trend) Default Stochastic settings ( 5, 3 , 3) Default Fast EMA : 13 Default Slow EMA : 22 Default ATR : 14 Conditions to show buying signal on main TimeFrame. (Yellow Triangle) - Check if the MACD Histogram is rising on the secondary timeframe. - Check if the Stochastic on the main timeframe is below 20. When deciding to buy, you can use the ATR channels to determine the stop loss and profit target. Indicateur Pine Script®par UnknownUnicorn2809877Mis à jour 11130
ATR & Price Action IndicatorHello there. This Script prints multiple Entries based on Price Action and ATR. Can be used on all timeframes. Kind regradsIndicateur Pine Script®par kNOCKEYYY1169
超级趋势(Supertrend)指标This is a normal Supertrend indicator which redesign and translate for Chinese. 这是一个通用的超级趋势(Supertrend)指标。 本脚本的目的在于帮助使用中文的人了解该指标,特别是其用法。同时将该指标代码添加完整的中文注释,方便使用中文的人学习Pine语言。 超级趋势指标(SuperTrend)是最常见的基于ATR的指标之一。 本指标的特色 相对于标准的超级趋势指标,在此版本中,你可以从设置中更改ATR计算方法。ATR的默认计算方式是采用RMA(RSI中使用的移动平均线,称之为指数加权移动平均线),本版本中可以使用SMA来替代计算ATR。 默认设置项为勾选状态,即ATR的计算方式为标准的RMA。 指标可调节参数 该指标有两个可设置的参数 1 ATR参数:默认为10; 2 ATR乘数:默认为3。 本指标还有两项可选设置项 1 价格源:价格源默认使用收盘价,但是你还可以选择使用开盘价、最高价、最低价等其他的价格计算方式; 指标用法 超级趋势指标出现在价格之上或价格之下时,就会产生买入和卖出信号。 买入信号: 当超级趋势指标在价格下方绘制时,即图表中的绿色信号线开始出现时,则产生买入信号;同时超级趋势指标的买入信号线可以作为买入的止损点; 卖出信号: 当超级趋势指标在价格上方绘制时,即图表中的红色信号线开始出现时,则产生卖出信号;同时超级趋势指标的卖出信号线可以作为卖出的止损点。 本指标支持配置买卖点的预警。 指标优势 1 适用于不同的时间周期和不同的交易品种; 2 对趋势有很好的识别效应; 3 可以提供明确的止损价位参考。 指标局限性 与其他趋势指标类似,超级趋势指标的作用在于帮助你抓住大趋势,但是在震荡行情,特别是长期的震荡行情中会失真,此时若按照超级趋势指标交易,则会产生亏损。 Indicateur Pine Script®par samuelx2121948
Opening Trend BounceCustom indicator that helps me with bounce plays. This indicator plots lines based on ATR; a line is added at every 25% of an ATR. The shaded columns at the beginning of the day are time based bounce zones; stocks that bounce, typically do so within those zones. Indicateur Pine Script®par CapitalMasteryMis à jour 33147
Trailing Stop LossTrailing stop loss indicator to determine when to exit a position. Multiple trailing stop loss calculation techniques are implemented: ATR: Determines stop loss using a gap from recent highest value, that gap is defined by the ATR value and a multiplier MA: Just a simple moving average used as a stop-loss Percentage: Uses a percentage of the price The script also implements alerting to be notified when the stop loss price is reached. Indicateur Pine Script®par mdeousMis à jour 77726
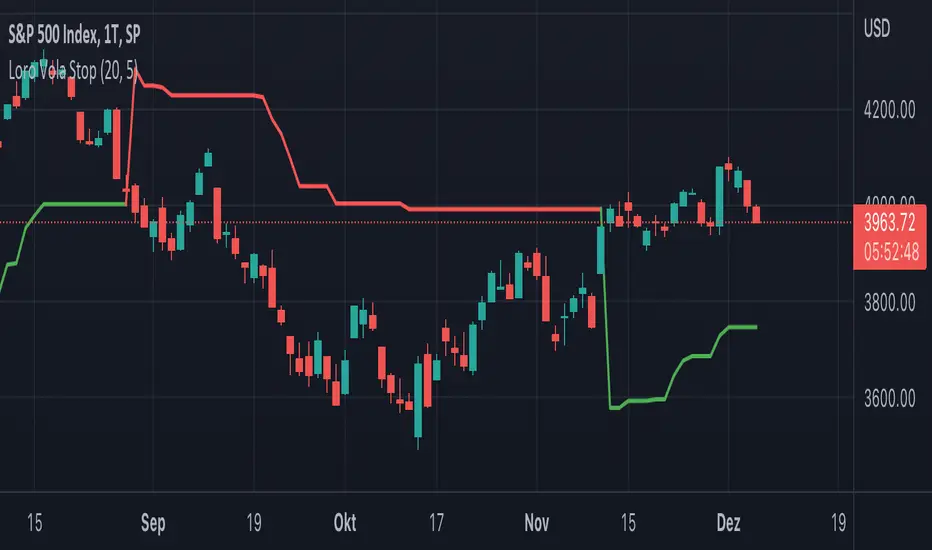
Loro Vola StopThis indicator is a variation of a chandelier volatility stop using an average true range. The indicator draws a green support line in an uptrend and a red resistance line in a downtrend. The signals normally should be used as exit triggers.Indicateur Pine Script®par Dezi20Mis à jour 174
HG Scalpius - ATR Up/Down Tick HighlightHG Scalpius - ATR Up/Down Tick Highlight This indicator highlights ATR(14) upticks (green) and downticks (red) and has the below application: - If a new trend closing high (low) is made on a downtick in ATR, decreasing volatility mode turns on If you come across or think of any other useful scripts for the HG Scalpius system please comment below! Links to 2 previous HG Scalpius scripts: - - Happy trading! Code: study(title="Average True Range", shorttitle="ATR", overlay=false) length = input(title="Length", defval=14, minval=1) smoothing = input(title="Smoothing", defval="RMA", options= ) ma_function(source, length) => if smoothing == "RMA" rma(source, length) else if smoothing == "SMA" sma(source, length) else if smoothing == "EMA" ema(source, length) else wma(source, length) ATR = ma_function(tr(true), length) c = ATR >= ATR ? color.lime : color.red plot(ATR, title = "ATR", color=c, transp=0) Indicateur Pine Script®par Autarch_Capital59
[LunaOwl] 11 kinds of Adaptive MA Model作品: 11種自適應性平滑模型 It integrates eleven kinds of adaptive moving average method. At first, I just wanted to make a ATR. Later, the price series ±N*ATR mult, to form two series. Then use the concept of support/resistance breakthrough to design it, and then two adaptive series formation channels were formed. Take the average of the two series as the signal. When the price crosses the signal, it's judged to be long or short. 整合了十一種能夠自適應性的移動平均模型。起初只是想要做一個基本款ATR指標,後來將價格加減N個ATR倍數,形成兩條序列形成通道,再使用支撐阻力突破的概念去設計它,再形成兩條自適應性的序列形成通道,再取中間值當成信號。當價格與信號交叉,則判斷作多或者作空。 --------------------------* Parameter 設置參數 Resolution: The default is "the same as the variety". Is a named constant for resolution input type of input function. 商品分辨率:預設與品種相同。是input函數的時間周期輸入類型的命名常量。 Smoothing: The default is Recursive Moving Average(RMA). It can choose other methods, the table is as follows. 平滑類型:預設是「遞回平均」,可以選擇其它方法,列表如下。 列表 / The table of moving averages is as follows: //****中英對照表*****##______________________________________ 1. 遞回平均 || Recursive Moving Average 2. 簡單平均 || Simple Moving Average 3. 指數平均 || Exponential Moving Average 4. 加權平均 || Weighted Moving Average 5. 船體平均 || Hull Moving Average 6. 成交量加權 || Volume Weighted Moving Average 7. 對稱加權 || Symmetric Weighted Moving Average 8. 雙重指數 || Double Exponential Moving Average 9. 三重指數 || Triple Exponential Moving Average 10. 高斯分佈 || Arnaud Legoux Moving Average 11. 提爾森T3 || Tillson T3 Moving Average //##_________________________________________________________ Candle Mode: There are three versions, original, two-color and four-color. 燭台模式:預設模式只區分趨勢,可以改成原版蠟燭或四種顏色版本。 Length: The default is 14, usually no need to adjust. 平滑期數:預設值是14,基本上不用理它。 Occurrence: The default is 1. The range is 0~10. The larger the value, the more delayed. If zero will become too sensitive and noise. 滯後性:預設值是1。調整範圍是0~10,數值愈大信號愈延遲,如果值為0,會變得過於敏捷,那將會失去平滑的意義。 N multiple: The default is 0.618, can be set to 1. The range is 0.382~3.000. 倍數N:預設值是0.618,也可以設定1,最低是0.382,最大是3。 --------------------------* 1. Candle Mode can set the original candle, cancel candle trend color changes. However, the background will still be filled. 可以設定顯示原版的蠟燭線,背景與線並不會消失。 2. Four-color version of candles. It shows changes in trends and prices. 四色版本的蠟燭線,可以顯示趨勢與每日收盤價的變化。 Indicateur Pine Script®par LunaOwlMis à jour 1717326