awesome
Indicateurs, stratégies et bibliothèques
The indicator includes Williams Alligator, Williams Fractals, Divergent Bars, Market Facilitation Index, Highest and Lowest Bars, maximum and minimum peak of Awesome Oscillator, and signal alerts based on Bill Williams' Profitunity strategy. MFI and Awesome Oscillator According to the Market Facilitation Index Oscillator, the Squat bar is colored blue, all...
The indicator includes an Awesome Oscillator with 2 vertical lines at a distance of 100 and 140 bars from the last bar to determine the third Elliott wave by the maximum peak of AO in the interval from 100 to 140 bars according to Bill Williams' Profitunity strategy. Additionally, a faster EMA line is displayed that calculates the difference between 5 Period and...
The indicator is called the "Awesome Cumulative Volume Oscillator" (ACVO), which analyzes the cumulative trading volume of the underlying asset. The indicator also plots the deviation of the cumulative trading volume from the first SMA value, which is referred to as the "Cumulative Volume Deviation". The zero-line is plotted as a reference point. If the...
INDIGO Cloud System © This script shows the monthly dip and peak zones and the daily highs & lows. The green zone is the dip zone. It's the place to enter a long position if you think there is or will be a reversal. The red zone is the peak zone. It's the place to enter a short position if you think there is or will be a reversal. The script uses the INDIGO...
There's nothing fancy here--I just like the look of this one. And it works pretty well. This started out as the standard Alligator indicator. There I reset all the offsets to 0 and added an Ichimoku Cloudish fill. Astute observers will notice a fourth line has been added at 34 SMA. It's a bit of a cheat. 34 SMA is the zero line of another classic B. Williams...
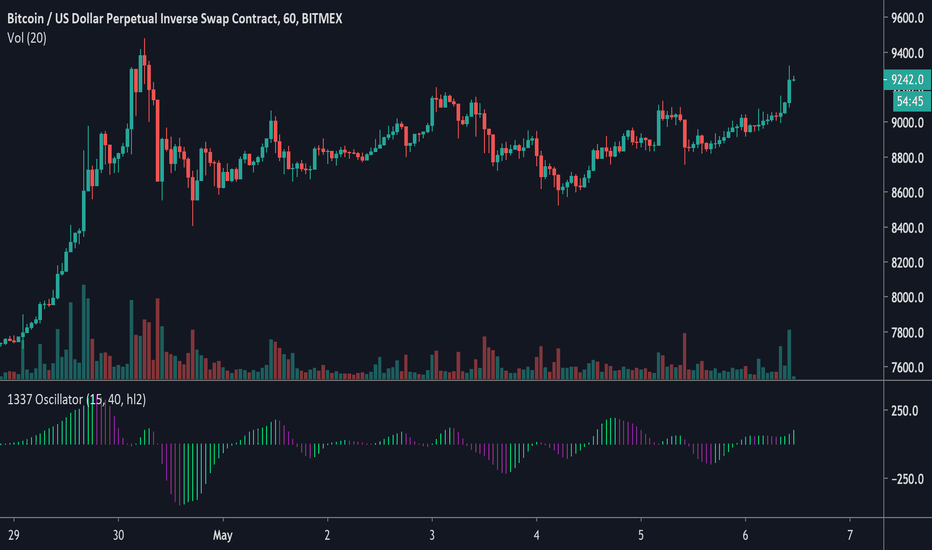
This script is inspired by the Awesome Oscillator by Bill Williams. The 1337 Oscillator uses a faster and more reactive hull moving average. Signals could be from the 0 line crosses or rising/falling.
This is combo strategies for get a cumulative signal. First strategy This System was created from the Book "How I Tripled My Money In The Futures Market" by Ulf Jensen, Page 183. This is reverse type of strategies. The strategy buys at market, if close price is higher than the previous close during 2 days and the meaning of 9-days Stochastic Slow...
Great script by Lemrin. I just added lines at the 6.5 and -5.0 levels for trend analysis per my own strategy and change the columns to area.
This indicator was originally developed by Bill M. Williams.
AWESOME OSCILLATOR V2 by KIVANC @fr3762 CONVERTING THE OSCILLATOR to a curved line and added a 7 period SMA as a signal line, crosses are BUY or SELL signals like in MACD Buy: when AO line crosses above signal line Sell: when Signal line crosses above AO line
The Accelerator Oscillator has been developed by Bill Williams as the development of the Awesome Oscillator. It represents the difference between the Awesome Oscillator and the 5-period moving average, and as such it shows the speed of change of the Awesome Oscillator, which can be useful to find trend reversals before the Awesome Oscillator does.
The Accelerator Oscillator has been developed by Bill Williams as the development of the Awesome Oscillator. It represents the difference between the Awesome Oscillator and the 5-period moving average, and as such it shows the speed of change of the Awesome Oscillator, which can be useful to find trend reversals before the Awesome Oscillator does.
This indicator is based on Bill Williams` recommendations from his book "New Trading Dimensions". We recommend this book to you as most useful reading. The wisdom, technical expertise, and skillful teaching style of Williams make it a truly revolutionary-level source. A must-have new book for stock and commodity traders. The 1st 2...
This indicator plots the oscillator as a histogram where blue denotes periods suited for buying and red . for selling. If the current value of AO (Awesome Oscillator) is above previous, the period is considered suited for buying and the period is marked blue. If the AO value is not above previous, the period is considered suited for selling...
Paints price bars green when AO+AC are both green, paints bars red when both are red, and paints bars grey when both are different. (IGNORE THE CHART DIDNT MEAN TO PUBLISH IT ON THIS CHART.. OPPS)
This indicator plots the oscillator as a histogram where blue denotes periods suited for buying and red . for selling. If the current value of AO (Awesome Oscillator) is above previous, the period is considered suited for buying and the period is marked blue. If the AO value is not above previous, the period is considered suited for selling...
This indicator is based on Bill Williams` recommendations from his book "New Trading Dimensions". We recommend this book to you as most useful reading. The wisdom, technical expertise, and skillful teaching style of Williams make it a truly revolutionary-level source. A must-have new book for stock and commodity traders. The 1st 2...
This indicator plots the oscillator as a histogram where blue denotes periods suited for buying and red . for selling. If the current value of AO (Awesome Oscillator) is above previous, the period is considered suited for buying and the period is marked blue. If the AO value is not above previous, the period is considered suited for selling...


