Trapper Magnifying Glass - Bar Decomposer — Last Visible BarHeadline
Decompose any higher-timeframe bar into lower-timeframe candles directly on the chart. Zoom/pan reactive, session-accurate, auto-fit inset, and compliant with TradingView placement limits.
Quick Start
Add the indicator and choose a Child TF (minutes) (e.g., 1, 5, 10, 15).
The inset follows the last visible bar on your screen. Adjust Right separation / Mini width / Gap / Vertical exaggeration as needed.
Leave Show HUD label OFF by default. Turn it on only if you want a compact readout.
Overview
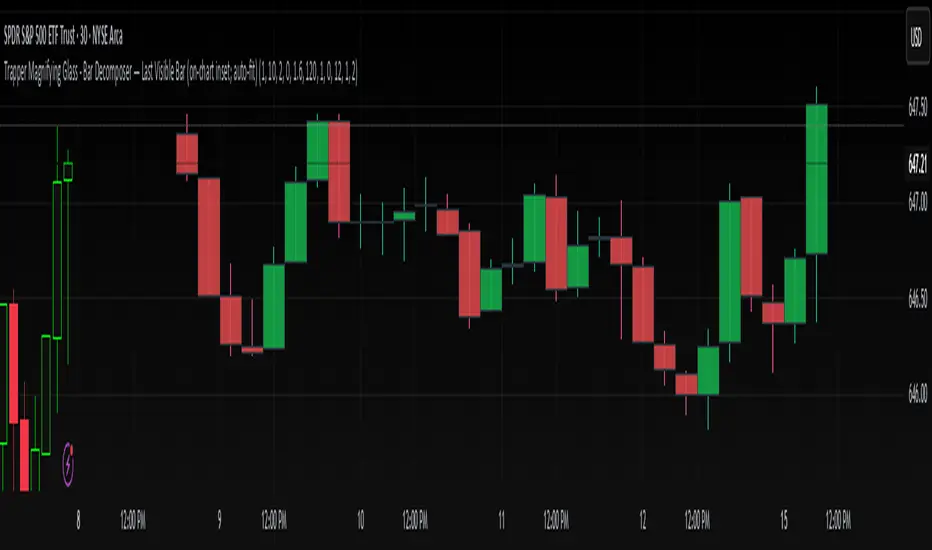
This tool draws a miniature, on-chart inset of lower-timeframe candles that make up the currently viewed higher-timeframe bar. It stays on the main price chart (not in a separate pane), respects zoom/pan, compresses itself to fit available space, and adheres to TradingView’s 500-bar object placement limit.
The design goal is micro-structure inspection without changing the chart timeframe.
What Makes It Different
On-chart inset (not a separate indicator panel) for true visual context.
Zoom/Pan reactive to the last visible bar — works naturally as you navigate.
Auto-fit logic keeps the inset readable while staying inside TradingView’s future-bars limit.
Session-accurate decomposition: uses TradingView’s own lower-timeframe OHLC, exactly within the parent bar’s time window.
Strictly compliant: no synthetic bars, no repaint tricks, no lookahead.
How It Works
Child data is fetched with request.security_lower_tf(syminfo.tickerid, , open/high/low/close).
Only closed lower-TF bars inside the parent bar’s time window are returned by TradingView.
The script maps each child bar to an inset candle (body + wick) scaled to the parent bar’s price range and placed to the right of the parent’s position.
The inset tracks the last visible bar so it always stays relevant to what you’re inspecting.
Inputs (Defaults)
Timeframes
Child TF (minutes): 1 (min 1, max 1440)
Layout
Right separation (bars): 10
Mini candle width (bars): 2
Gap between mini candles (bars): 0
Vertical exaggeration ×: 1.6
Auto-Fit
Auto-fit inset width: ON
Max bars ahead to use: 120
Minimum mini width: 1
Minimum gap: 0
Style
Bull/Bear colors: ON
Body Bull / Body Bear / Wick Bull / Wick Bear: configurable
Body Fill Opacity (0–100): 12
Outline color: dark grey
Outline width: 1
Wick width: 2
HUD
Show HUD label: OFF (recommended default; enable only when you need a summary)
Session Behavior (Important)
TradingView constructs bars strictly by exchange sessions. For US equities (regular session 09:30–16:00, 390 minutes):
On a 1h chart you will see 7 bars per day:
09:30–10:00 (30 minutes)
10:00–11:00, 11:00–12:00, 12:00–13:00, 13:00–14:00, 14:00–15:00 (five full hours)
15:00–16:00 (full hour)
Decomposing the 09:30–10:00 bar into 1m returns 30 minis (not 60).
Decomposing 10:00–11:00 returns 60 minis, as expected.
The last hour (15:00–16:00) decomposes to 60 minis once they exist (i.e., immediately after each child bar closes). If you are mid-session, you will see only the minis that have closed so far.
This is by design and ensures the inset reflects the true lower-timeframe structure TradingView has for that exact bar window. Nothing is synthesized.
Live vs Confirmed Bars
Confirmed bars (historical) always decompose to a full, correct count of child minis for that parent window.
Live bars (currently forming) only return child minis that have already closed. Mid-hour on a 1h chart with 10m children, you might see 3, 4, or 5 minis depending on elapsed time.
This script’s default experience focuses on the last visible bar and displays whatever the platform provides at that moment. The HUD (when enabled) includes the parent bar duration in minutes to make short session bars explicit.
Auto-Fit and Placement Limits
TradingView prevents drawing objects beyond 500 bars into the future. The inset’s right edge is automatically clamped to stay within that boundary. If the requested number of minis would overflow the allowed space, the script proportionally compresses mini width/gap (down to your configured minimums). If necessary, it draws only as many minis as safely fit — favoring stability over clutter.
Styling Tips
For dense decompositions (e.g., 1m inside 1h), set:
Mini width = 1, Gap = 0, Auto-fit = ON, Right separation = 7–12.
Increase Vertical exaggeration to highlight wick-to-body differences when the parent bar is narrow.
Keep HUD OFF for publishing and screenshots unless you’re highlighting counts or session duration.
Notes & Limitations
Child arrays show closed bars only. No forming mini is displayed to avoid misleading totals.
If you reload a chart or switch symbols/timeframes, the most recent confirmed bar’s arrays may be empty on the very first calculation frame; the script guards against this and will draw on the next update.
The tool is an overlay visualization, not a signal generator; there are no alerts or trading advice.
Performance: heavy decompositions on very fast symbols/timeframes can add many objects. Auto-fit and minimal widths help.
Compliance
Uses only native TradingView data (request.security_lower_tf).
No repainting and no lookahead.
No external feeds, synthetic candles, or hidden calculations that would misrepresent the underlying data.
Fully respects TradingView’s object placement constraints.
Recommended Defaults (for broad usability)
Child TF: 5 or 15 (depending on your HTF).
Right separation: 7–12
Mini width / Gap: 2 / 0 for clarity, 1 / 0 for dense fits.
Auto-fit: ON
HUD: OFF
Troubleshooting
“Why aren’t there 60 one-minute minis in this 1h bar?”
Either the parent bar is a session-short bar (09:30–10:00 = 30 minutes) or you are viewing a live bar mid-hour; only closed minis appear.
Inset clipped or not visible to the right:
Increase Max bars ahead to use (Auto-Fit group), reduce Mini width/Gap, or reduce Right separation.
Nothing draws on first load:
Wait for the next bar update, or navigate the chart so the last visible bar changes; arrays refresh as data becomes available.
Change Log
v1.0 – Initial public release.
On-chart inset, zoom/pan reactive, auto-fit width.
Session-accurate lower-TF decomposition.
HUD label toggle (off by default) with child TF, bar count, and parent duration.
Hardened array handling for confirmed snapshots.
Disclaimer
This script is provided strictly for educational and informational purposes only.
It does not constitute financial advice, investment advice, trading signals, or a recommendation to buy or sell any security, asset, or instrument. Trading and investing involve risk; always do your own research and consult with a licensed financial professional before making decisions.
Barmagnifier
Auto-magnifier / quantifytools- Overview
Auto-magnifier shows a lower timeframe view of candles and volume bars inside any main timeframe candle by zooming into it. Candles and volume bars as they develop are shown chronologically from left to right. By default, magnifier is triggered when less than 3 candles are visible on the chart.
By default, 20 lower timeframe candles are displayed by splitting main timeframe into 20 parts. The amount of candles displayed is a target rate, meaning the script will use a lower timeframe that has the closest match to 20 candles and therefore will vary a bit. Users can override automatic timeframe calculation and opt in to display any specific lower timeframe or adjust amount of candles shown (e.g. 20 -> 30 candles) per each main timeframe candle.
Example
Main timeframe set to 30 minute, candles displayed set to 20 -> Magnifying using 2 minute candles (30 minute/20 candles = 1.5 min, rounded to 2 min)
Main timeframe set to 30 minute, override set to 5 minutes -> Displaying 5 minute candles
Size of volume bars is calculated using relative volume (volume relative to volume SMA20), lowest bar representing relative volume values of under or equal to 1x the moving average and from there onwards progressively growing.
- Limitations and considerations
Amount of candles shown might flow over from the background on smaller screen sizes, in which case you would want to decrease the amount shown. Opposite is true for bigger screens, this value can be increased as more candles fit.
This indicator involves a lot of tricks with text elements to make it work automatically by zooming in. Size of wicks, bodies and volume bars are calculated by adding more text elements on big candles and less text elements on smaller candles. This means the displayed candles won't be a 100% match, but a rather a fair representation of the view, e.g. candle is green = lower timeframe candle is green, candle has a big wick = lower timeframe candle has a big wick (but not a 100% match).
Example
Magnified lower timeframe chart vs. Actual lower timeframe chart
Most mismatch will be found on the price levels where lower timeframe candles are shown, which is sacrificed for the sake of getting a better readability on the overall shape of lower timeframe price action. Users can alternatively optimize calculations for more accuracy, giving a better representation of the price levels where candles truly originated. This typically comes with the cost of worse readability however.
Example
Optimized for readability vs. Optimized for accuracy
- Visuals
All visual elements are fully customizable.
