Naive Bayes Candlestick Pattern Classifier v1.1 BETAAn intermezzo on why i made this script publication..
A : Candlestick Pattern took hours to backtest, why not using Machine Learning techniques?
B : Machine Learning, no that's gonna be really heavy bro!
A : Not really, because we use Naive Bayes.
B : The simplest, yet powerful machine learning algorithm to separate (a.k.a classify) multivariate data.
----------------------------------------------------------------------------------------------------------------------
Hello, everyone!
After deep research in extracting meaningful information from the market, I ended up building this powerful machine learning indicator based on the evolution of Bayesian Statistics. This indicator not only leverages the simplicity of Naive Bayes but also extends its application to candlestick pattern analysis, making it an invaluable tool for traders who are looking to enhance their technical analysis without spending countless hours manually backtesting each pattern on each market!.
What most interesting part is actually after learning all of likely useless methods like fibonacci, supply and demand, volume profile, etc. We always ended up back to basic like support and resistance and candlestick patterns, but with a slight twist on strategy algorithm design and statistical approach. Thus, the only reason why i made this, because i exactly know that you guys will ended up in this position as time goes by.
The essence of this indicator lies in its ability to automate the recognition and statistical evaluation of various candlestick patterns. Traditionally, traders have relied on visual inspection and manual backtesting to determine the effectiveness of patterns like Bullish Engulfing, Bearish Engulfing, Harami variations, Hammer formations, and even more complex multi-candle patterns such as Three White Soldiers, Three Black Crows, Dark Cloud Cover, and Piercing Pattern. However, these conventional methods are both time-consuming and prone to subjective bias.
To address these challenges, I employed Naive Bayes—a probabilistic classifier that, despite its simplicity, offers robust performance in various domains. Naive Bayes assumes that each feature is independent of the others given the class label, which, although a strong assumption, works remarkably well in practice, especially when the dataset is large like market data and the feature space is high-dimensional. In our case, each candlestick pattern acts as a feature that can be statistically evaluated based on its historical performance. The indicator calculates a probability that a given pattern will lead to a price reversal, by comparing the pattern’s close price to the highest or lowest price achieved in a lookahead window.
One of the standout features of this script is its flexibility. Each candlestick pattern is not only coded into the system but also comes with individual toggles to enable or disable them based on your trading strategy. This means you can choose to focus on single-candle patterns like Bullish Engulfing or more complex multi-candle formations such as Three White Soldiers, without modifying the core code. The built-in customization options allow you to adjust colors and labels for each pattern, giving you the freedom to tailor the visual output to your preference. This level of customization ensures that the indicator integrates seamlessly into your existing TradingView setup.
Moreover, the indicator isn’t just about pattern recognition—it also incorporates outcome-based learning. Every time a pattern is detected, it looks ahead a predefined number of bars to evaluate if the expected reversal actually materialized. This outcome is then stored in arrays, and over time, the script dynamically calculates the probability of success for each pattern. These probabilities are presented in a real-time updating table on your chart, which shows not only the percentage probability but also the count of historical occurrences. With this information at your fingertips, you can quickly gauge the reliability of each pattern in your chosen market and timeframe.
Another significant advantage of this approach is its speed and efficiency. While more complex machine learning models like neural networks might require heavy computational resources and longer training times, the Naive Bayes classifier in this script is lightweight, instantaneous and can be updated on the fly with each new bar. This real-time capability is essential for modern traders who need to make quick decisions in fast-paced markets.
Furthermore, by automating the process of backtesting, the indicator frees up your time to focus on other aspects of trading strategy development. Instead of manually analyzing hundreds or even thousands of candles, you can rely on the statistical power of Naive Bayes to provide you with insights on which patterns are most likely to result in profitable moves. This not only enhances your efficiency but also helps to eliminate the cognitive biases that often plague manual analysis.
In summary, this indicator represents a fusion of traditional candlestick analysis with modern machine learning techniques. It harnesses the simplicity and effectiveness of Naive Bayes to deliver a dynamic, real-time evaluation of various candlestick patterns. Whether you are a seasoned trader looking to refine your technical analysis or a beginner eager to understand market dynamics, this tool offers a powerful, customizable, and efficient solution. Welcome to a new era where advanced statistical methods meet practical trading insights—happy trading and may your patterns always be in your favor!
Note : On this current released beta version, you must manually adjust reversal percentage move based on each market. Further updates may include automated best range detection and probability.
Bayesianprobability

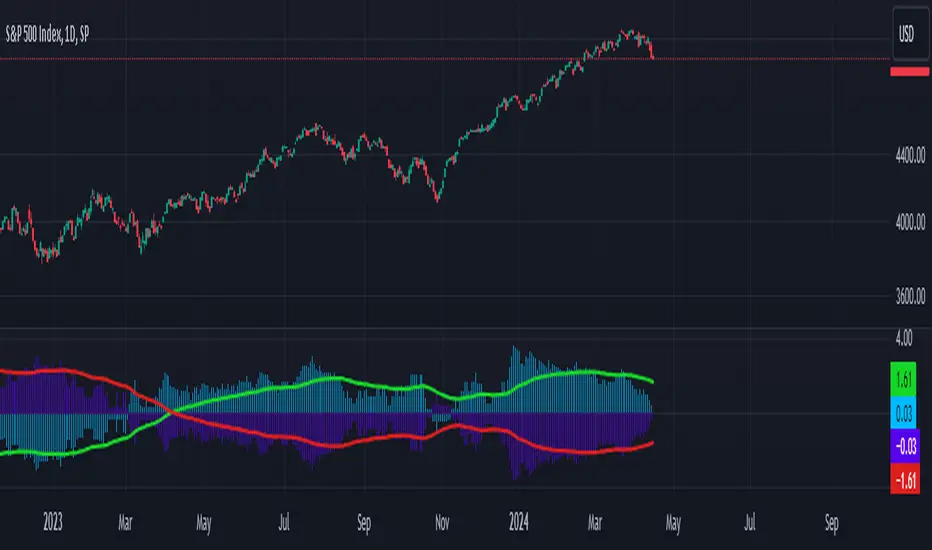
Dual Bayesian For Loop [QuantAlgo]Discover the power of probabilistic investing and trading with Dual Bayesian For Loop by QuantAlgo , a cutting-edge technical indicator that brings statistical rigor to trend analysis. By merging advanced Bayesian statistics with adaptive market scanning, this tool transforms complex probability calculations into clear, actionable signals—perfect for both data-driven traders seeking statistical edge and investors who value probability-based confirmation!
🟢 Core Architecture
At its heart, this indicator employs an adaptive dual-timeframe Bayesian framework with flexible scanning capabilities. It utilizes a configurable loop start parameter that lets you fine-tune how recent price action influences probability calculations. By combining adaptive scanning with short-term and long-term Bayesian probabilities, the indicator creates a sophisticated yet clear framework for trend identification that dynamically adjusts to market conditions.
🟢 Technical Foundation
The indicator builds on three innovative components:
Adaptive Loop Scanner: Dynamically evaluates price relationships with adjustable start points for precise control over historical analysis
Bayesian Probability Engine: Transforms market movements into probability scores through statistical modeling
Dual Timeframe Integration: Merges immediate market reactions with broader probability trends through custom smoothing
🟢 Key Features & Signals
The Adaptive Dual Bayesian For Loop transforms complex calculations into clear visual signals:
Binary probability signal displaying definitive trend direction
Dynamic color-coding system for instant trend recognition
Strategic L/S markers at key probability reversals
Customizable bar coloring based on probability trends
Comprehensive alert system for probability-based shifts
🟢 Practical Usage Tips
Here's how you can get the most out of the Dual Bayesian For Loop :
1/ Setup:
Add the indicator to your TradingView chart by clicking on the star icon to add it to your favorites ⭐️
Start with default source for balanced price representation
Use standard length for probability calculations
Begin with Loop Start at 1 for complete price analysis
Start with default Loop Lookback at 70 for reliable sampling size
2/ Signal Interpretation:
Monitor probability transitions across the 50% threshold (0 line)
Watch for convergence of short and long-term probabilities
Use L/S markers for potential trade signals
Monitor bar colors for additional trend confirmation
Configure alerts for significant trend crossovers and reversals, ensuring you can act on market movements promptly, even when you’re not actively monitoring the charts
🟢 Pro Tips
Fine-tune loop parameters for optimal sensitivity:
→ Lower Loop Start (1-5) for more reactive analysis
→ Higher Loop Start (5-10) to filter out noise
Adjust probability calculation period:
→ Shorter lengths (5-10) for aggressive signals
→ Longer lengths (15-30) for trend confirmation
Strategy Enhancement:
→ Compare signals across multiple timeframes
→ Combine with volume for trade validation
→ Use with support/resistance levels for entry timing
→ Integrate other technical tools for even more comprehensive analysis

Bayesian Bias OscillatorWhat is a Bayes Estimator?
Bayesian estimation, or Bayesian inference, is a statistical method for estimating unknown parameters of a probability distribution based on observed data and prior knowledge about those parameters. At first , you will need a prior probability distribution, which is a prior belief about the distribution of the parameter that you are interested in estimating. This distribution represents your initial beliefs or knowledge about the parameter value before observing any data. Second , you need a likelihood function, which represents the probability of observing the data given different values of the parameter. This function quantifies how well different parameter values explain the observed data. Then , you will need a posterior probability distribution by combining the prior distribution and the likelihood function to obtain the posterior distribution of the parameter. The posterior distribution represents the updated belief about the parameter value after observing the data.
Bayesian Bias Oscillator
This tool calculates the Bayes bias of returns, which are directional probabilities that provide insight on the "trend" of the market or the directional bias of returns. It comes with two outputs: the default one, which is the Z-Score of the Bayes Bias, and the regular raw probability, which can be switched on in the settings of the indicator.
The Z-Score output value doesn't tell you the probability, but it does tell you how much of a standard deviation the value is from the mean. It uses both probabilities, the probability of a positive return and the probability of a negative return, which is just (1 - probability of a positive return).
The probability output value shows you the raw probability of a positive return vs. the probability of a negative return. The probability is the value of each line plotted (blue is the probability of a positive return, and purple is the probability of a negative return).
Bayesian predictive leading indicator--------- ENGLISH ---------
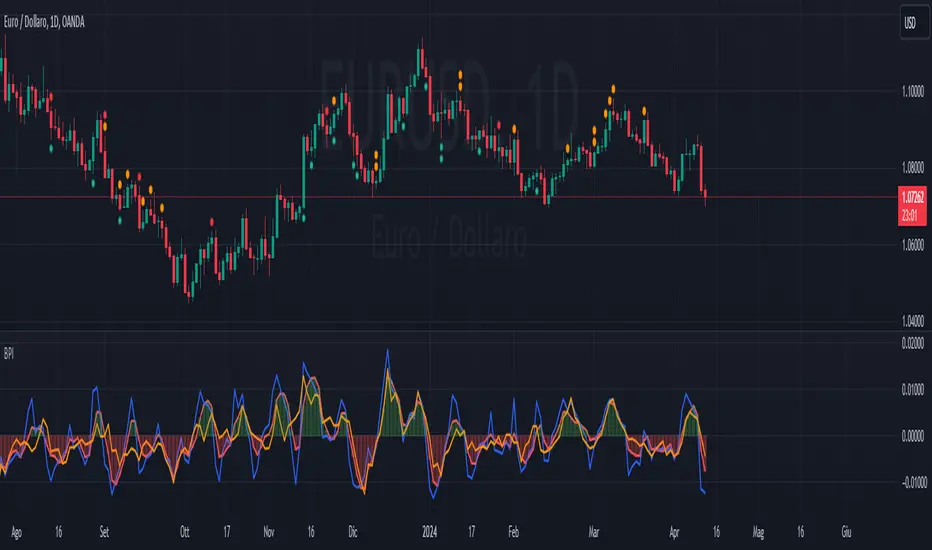
This is a predictive indicator ( leading indicator ) that uses Bayes' formula to calculate the conditional probability of price increases given the angular coefficient. The indicator calculates the angular coefficient and its regression and uses it to predict prices.
Bayes' theorem is a fundamental result of probability theory and is used to calculate the probability of a cause causing the verified event. In other words, for our indicator, Bayes' theorem is used to calculate the conditional probability of one event (price event in this case) with respect to another event by calculating the probabilities of the two events (past price) and the conditional probability of the second event (future price) with respect to the first event.
The red line represents the angular coefficient. The blue line represents the normalized expected price. Finally, the yellow line represents the conditional probability that the price will increase or decrease.
How to use it. In addition to the convenient histogram, which follows the angular coefficient, another practical operational application might be to go long when the blue line is above the red and yellow lines. Conversely short when the blue is below the red and yellow.
When the yellow line passes above all others, a reversal in the long direction is imminent and vice versa.
The extent of the reversal depends on how far the yellow line will be away in price from the other 2 lines.
This indicator is in its embryonic state and updates will follow to make it more graphically readable, add alerts, etc.
Stay tuned! Leave a boost and comment or write to me if you wish.
--------- ITALIANO ---------
Questo è un indicatore predittivo ( leading indicator ) che utilizza la formula di Bayes per calcolare la probabilità condizionata che il prezzo aumenti dato il coefficiente angolare. L’indicatore calcola il coefficiente angolare e la sua regressione e lo utilizza per prevedere i prezzi.
Il teorema di Bayes è un risultato fondamentale della teoria della probabilità e viene impiegato per calcolare la probabilità di una causa che ha provocato l’evento verificato. In altre parole, per il nostro indicatore, il teorema di Bayes serve per calcolare la probabilità condizionata di un evento (di prezzo in questo caso) rispetto a un altro evento, calcolando le probabilità dei due eventi (prezzo passato) e la probabilità condizionata del secondo evento (prezzo futuro) rispetto al primo.
La linea rossa rappresenta il coefficiente angolare. La linea blu rappresenta il prezzo previsto normalizzato. Infine la linea gialla rappresenta la probabilità condizionata che il prezzo aumenti o diminuisca.
Come si usa? Oltre al comodo istogramma, che segue il coefficiente angolare, un'altra applicazione operativa pratica potrebbe essere di andare long quando la linea blu è sopra la linea rossa e gialla. Viceversa short quando la blu è sotto la rossa e la gialla.
Quando la linea gialla passa sopra tutte le altre è imminente un'inversione in direzione long e viceversa.
L'entità dell'inversione dipende da quanto la linea gialla sarà distante di prezzo dalle altre 2 linee.
Questo indicatore è al suo stato embrionale e seguiranno aggiornamenti per renderlo graficamente più leggibile, aggiungere alert, ecc.
Stay tuned! Lascia un boost e commenta o scrivimi se desideri.
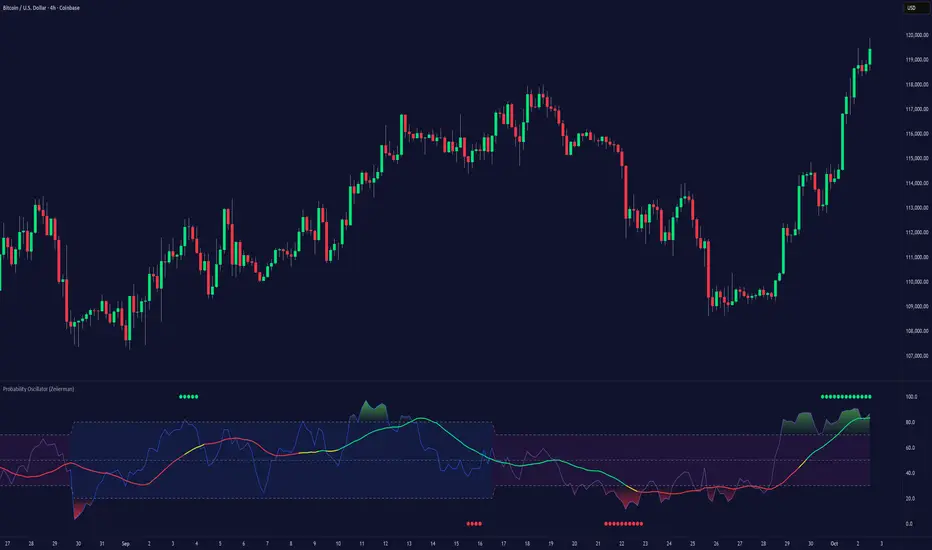
Probability Oscillator (Zeiierman)█ Overview
The Probability Oscillator (Zeiierman) turns price dynamics into a regime-aware probability map of continuation vs. reversal. Rather than treating momentum as a single, fixed signal, it adapts its core estimator to current market conditions—favoring trend persistence in calm regimes and oscillation/reversion in volatile regimes.
You get a fast Probability line, a slower Signal line, dynamic OB/OS bounds, midline bias, color-coded trend probability, background regime cues, and Momentum Impulse dots that reveal concentrated bursts of directional intent. Beneath the surface, the Probability line functions as a sequential Bayesian filter — continuously updating a regime-conditioned prior (trend or volatility) with new market evidence. The resulting posterior odds are then expressed as a bounded oscillator for intuitive interpretation. In stable markets, the prior favors continuity; in volatile markets, it reweights toward mean reversion.
⚪ Why This One Is Unique
The Probability Oscillator operates within a self-adaptive probabilistic framework that continuously reshapes itself in response to the market’s evolving structure. Rather than relying on fixed formulas or static thresholds, it employs a context-aware Bayesian core that interprets flow dynamics through an adaptive regime model.
Its internal architecture blends state recognition, probability normalization, and dynamic envelope mapping, allowing it to adjust between conditions of directional stability and volatility-driven reversion fluidly. The result is an intelligent, self-adjusting probability field that remains stable in trends, reactive in consolidations, and contextually aware across all market states—delivering a refined sense of probabilistic direction without exposing raw computational structure.
█ Main Features
⚪ Probability Oscillator
At the core lies a probability-driven oscillator that continuously adapts its internal weighting to evolving market behavior. It translates incoming price evidence into a smooth probability curve that distinguishes between continuation and reversion phases, providing a refined view of conviction beneath price action.
The Probability Oscillator estimates the likelihood of trend continuation while dynamically adjusting to the surrounding volatility regime:
Probability Line (fast) – Captures short-term probability shifts, weighted by current market conditions — calm or volatile.
Signal Line (slow) – A smoothed probability filter that defines the prevailing bias and confirms directional persistence.
Momentum Impulse Dots – Small markers highlighting bursts of positive (green) or negative (red) momentum, indicating transitions in conviction strength.
The oscillator’s probabilistic framework automatically transitions between two self-adaptive modes:
Low-Volatility Mode – Prioritizes directional momentum and smooth trend continuity, ideal for trending markets.
High-Volatility Mode – Emphasizes oscillatory probability swings and reversals, optimized for range-bound or transitional conditions.
This dual-regime behavior allows the Probability Oscillator to remain stable in directional trends yet responsive in volatile ranges, producing a coherent probabilistic signal across any timeframe.
⚪ Trend Probability Coloring
The Trend Probability Coloring system transforms the Signal Line into a live confidence gauge. Its adaptive hue reflects the underlying probabilistic bias — green for sustained bullish pressure, red for bearish control, and yellow during transitional uncertainty. Behind the scenes, it applies curvature-sensitive weighting and probabilistic smoothing to display a visually coherent measure of directional conviction.
⚪ Impulse Dots
Impulse Dots identify moments of concentrated momentum expansion — short bursts of probabilistic acceleration that often precede shifts in structure. Each impulse represents a localized jump in directional confidence, isolating meaningful change-points from background noise. The result is a precise visualization of where probability and price begin to align, revealing early cues of strength, exhaustion, or imminent rotation.
█ How to Use
⚪ Trend Following
The Signal Line acts as the long-term probabilistic trend gauge, revealing when the market is building or losing directional conviction. Its slope and color communicate both bias and transition strength:
Green → bullish probability bias (trend continuation likely).
Red → bearish probability bias (downside continuation likely).
Yellow → transitional or indecisive phase (potential regime shift).
Use the Signal Line to confirm directional alignment:
A transition from red → yellow → green signals that the market is turning bullish and probability is shifting toward continuation on the upside.
A transition from green → yellow → red signals that bullish conviction is fading and bearish control is emerging.
⚪ Overbought & Oversold
The Probability Oscillator can also be used to identify overbought and oversold conditions by observing when the Probability Line moves above its upper bound or below its lower bound. These events often signal potential market slowdowns, pullbacks, or even broader reversals depending on context and regime.
The OB/OS levels automatically adapt to the prevailing market mode:
Trend Mode (~70/30) – Optimized for riding trends and timing pullbacks within directional continuations.
Volatility Mode (~80/20) – Tailored for fading extremes and capturing fast mean-reversion moves during consolidation phases.
Signals: Reclaims from oversold zones within a bullish bias, or rejections from overbought zones in a bearish bias, represent high-probability inflection points — especially when confirmed by Impulse Dots or regime-aligned Signal Line color transitions.
⚪ Using Volatility Modes to Choose Strategy
The Probability Oscillator automatically adapts its behavior to the active volatility regime, enabling traders to align their approach with the current market state. One of the most effective ways to use the tool is to select a trading strategy that aligns with the prevailing market mode.
Trend Mode (purple fill) – Represents low-volatility, directional environments where markets move smoothly and sustain momentum over time. In these conditions, a trend-following approach is most effective. Focus on the broader direction, participate on Probability-over-Signal crossups above 50, and trail positions as long as the Signal Line remains green. These calm phases often persist before volatility expansion, making them ideal for riding steady continuation waves rather than reacting to short-term fluctuations.
Volatility Mode (blue switch bar) – Activates in high-volatility conditions, signaling increased market agitation and sharper price swings. In this regime, trading becomes more tactical. Mean-reversion and scalping strategies perform best—fade OB/OS extremes, use midline reclaims for timing, or trade Impulse confirmations to capture breakout accelerations and short-term momentum surges.
⚪ Impulse
The Momentum Impulses highlight periods when the market experiences sharp bursts of directional momentum, marking transitions in conviction strength and energy expansion.
Green top dots → Indicate strong bullish impulses, often signaling the onset or acceleration of upward momentum.
Red bottom dots → Indicate strong bearish impulses, highlighting pressure buildup or downside continuation.
These impulses are particularly useful in two contexts:
During ranging markets , they help confirm overbought and oversold conditions, signaling when reversals or exhaustion points are highly probable.
During regime transitions , they validate breakout strength, confirming that new directional phases are supported by genuine momentum rather than noise.
In essence, Impulse Dots visualize the heartbeat of market conviction—pinpointing where momentum surges align with probabilistic bias, whether to confirm a breakout or warn of exhaustion in choppy conditions.
█ How It Works
⚪ Regime Switch Engine
At the foundation lies a Bayesian regime adaptation process that treats volatility as evolving market evidence. The system continuously updates a prior belief about whether the market favors directional persistence or oscillatory reversion. In calm states, it maintains a continuity-biased belief structure that favors smoother probability propagation.
Calculation: Employs a volatility-normalized Bayesian comparator, generating a posterior distribution over regime likelihoods. This ensures the oscillator remains statistically invariant to scale and consistent across instruments and timeframes.
⚪ Trend Probability Coloring (Conviction Layer)
The Trend Probability Coloring system visualizes Bayesian posterior confidence in real time. It continuously updates the Signal Line’s color as new evidence shifts the model’s belief between bullish, neutral, and bearish states.
When the posterior probability leans strongly upward, the line turns green; as uncertainty grows, it fades to yellow; and when conviction turns negative, it transitions to red. Each color change represents a probabilistic reweighting — the model’s evolving assessment of directional dominance.
Calculation: Applies posterior-weighted smoothing and curvature-based confidence mapping to translate Bayesian belief strength into a fluid visual gradient.
⚪ Momentum Impulse Engine
The Momentum Impulse Engine detects sudden bursts in probabilistic conviction — moments when the Bayesian posterior sharply reweights toward one directional outcome. These impulses represent statistically significant shifts in belief, where new evidence rapidly alters the model’s assessment of market direction.
Green impulses highlight surges in bullish probability; red impulses mark spikes in bearish conviction. Each impulse reflects a brief phase of directional dominance, revealing where probability momentum begins to accelerate or exhaust.
Calculation: Employs nonlinear Bayesian change detection and extreme-value gating to isolate abrupt posterior inflections.
-----------------
Disclaimer
The content provided in my scripts, indicators, ideas, algorithms, and systems is for educational and informational purposes only. It does not constitute financial advice, investment recommendations, or a solicitation to buy or sell any financial instruments. I will not accept liability for any loss or damage, including without limitation any loss of profit, which may arise directly or indirectly from the use of or reliance on such information.
All investments involve risk, and the past performance of a security, industry, sector, market, financial product, trading strategy, backtest, or individual's trading does not guarantee future results or returns. Investors are fully responsible for any investment decisions they make. Such decisions should be based solely on an evaluation of their financial circumstances, investment objectives, risk tolerance, and liquidity needs.
Script payant