Stochastic BTC OptimizedEnhanced Stochastic for Bitcoin (BTC) – Optimized for Daily Timeframe
This enhanced Stochastic oscillator is specifically fine-tuned for BTC/USD on the 1D timeframe, leveraging historical data from Bitstamp (2011–2025) to minimize false signals and maximize reliability in Bitcoin's volatile swings.
Unlike the classic Stochastic (14, 3, 3), this version uses optimized parameters:
- K Period = 21 – smoother reaction, better suited for BTC’s macro cycles
- D Period = 3, Smooth K = 3 – reduces noise while preserving responsiveness
- Overbought = 85, Oversold = 15 – accounts for BTC’s tendency to trend strongly within extreme zones without immediate reversal
✅ Smart Signal Logic:
Buy/sell signals appear only when %K crosses %D inside the oversold (≤15) or overbought (≥85) zones, and only the first signal is shown to avoid whipsaws.
Visual Enhancements:
- Thick lines when %K/%D are in overbought/oversold zones
- Green/red background highlights on valid signals
- Optional up/down arrows for clear entry visualization
- Customizable colors, line widths, and transparency
🔒 No alerts included – clean, focused on price action and momentum.
💡 Pro Tip: For even higher accuracy, use this indicator in combination with a long-term trend filter (e.g., EMA 200). The oscillator excels in ranging or retracement phases but should not be used alone in strong parabolic moves.
Based on Mozilla Public License v2.0 – feel free to use, modify, and share. Perfect for swing traders and long-term Bitcoin analysts seeking high-probability reversal zones.
перевод на русский
Улучшенный Stochastic для Bitcoin (BTC) — оптимизирован для дневного таймфрейма
Этот улучшенный осциллятор Stochastic специально настроен под BTC/USD на дневном графике, с учётом исторических данных Bitstamp (2011–2025), чтобы минимизировать ложные сигналы и повысить надёжность в условиях высокой волатильности биткоина.
В отличие от классического Stochastic (14, 3, 3), эта версия использует оптимизированные параметры:
- Период K = 21 — более плавная реакция, лучше соответствует макроциклам BTC
- Период D = 3, Сглаживание K = 3 — снижает шум, сохраняя отзывчивость
- Уровень перекупленности = 85, перепроданности = 15 — учитывает склонность BTC к сильным трендам в экстремальных зонах без немедленного разворота
✅ Интеллектуальная логика сигналов:
Покупка/продажа отображается только при пересечении %K и %D внутри зоны перепроданности (≤15) или перекупленности (≥85), и только первый сигнал фиксируется, чтобы избежать «хлыстов».
Улучшенная визуализация:
- Жирные линии, когда %K/%D находятся в экстремальных зонах
- Зелёный/красный фон при появлении сигналов
- Опциональные стрелки для чёткого отображения точек входа
- Настройка цветов, толщины линий и прозрачности
🔒 Без алертов — чистый инструмент, сфокусированный на цене и импульсе.
💡 Совет профессионала: для ещё большей точности используйте этот индикатор вместе с трендовым фильтром (например, EMA 200). Осциллятор лучше всего работает в фазах консолидации или отката, но не стоит применять его в одиночку во время сильных параболических движений.
На основе Mozilla Public License v2.0 — свободно используйте, модифицируйте и делитесь. Идеален для свинг-трейдеров и аналитиков Bitcoin, ищущих зоны с высокой вероятностью разворота.
Bearish-divergence

RSI BB StdDev SignalOverview
The RSI BB StdDev Signal Indicator is a powerful tool designed to enhance your trading strategy by combining the Relative Strength Index (RSI) with Bollinger Bands (BB). This unique combination allows traders to identify potential buy and sell signals more accurately by leveraging the strengths of both indicators. The RSI helps in identifying overbought and oversold conditions, while the Bollinger Bands provide a dynamic range to assess volatility and potential price reversals.
Key Features
— RSI Calculation: The indicator calculates the RSI based on user-defined parameters, allowing for customization to fit different trading styles.
— Bollinger Bands Integration: The RSI values are smoothed using a moving average, and Bollinger Bands are applied to this smoothed RSI to generate buy and sell signals.
— Divergence Detection: The indicator includes an optional feature to detect and alert on bullish and bearish divergences between the RSI and price action.
— Customizable Alerts: Users can set up alerts for buy and sell signals, as well as for divergences, ensuring they never miss a trading opportunity.
— Visual Aids: The indicator plots the RSI, Bollinger Bands, and signals on the chart, making it easy to visualize and interpret the data.
How It Works
1. RSI Calculation:
— The RSI is calculated using the change in the source input (default is close price) over a specified period.
— The RSI values are then plotted on the chart with customizable overbought and oversold levels.
2. Smoothing and Bollinger Bands:
— The RSI values are smoothed using a moving average (SMA, EMA, SMMA, WMA, VWMA) selected by the user.
— Bollinger Bands are applied to the smoothed RSI to create dynamic upper and lower bands.
3. Signal Generation:
—Buy signals are generated when the RSI crosses above the lower Bollinger Band.
—Sell signals are generated when the RSI crosses below the upper Bollinger Band.
—These signals are plotted on both the RSI pane and the main price chart for easy reference.
4. Divergence Detection:
— The indicator can detect and alert on regular bullish and bearish divergences between the RSI and price action.
— Bullish divergences occur when the price makes a lower low, but the RSI makes a higher low.
— Bearish divergences occur when the price makes a higher high, but the RSI makes a lower high.
Usage
1. Setting Up:
— Add the indicator to your TradingView chart.
— Customize the RSI length, source, and other parameters in the settings panel.
— Enable or disable the divergence detection based on your trading strategy.
2. Interpreting Signals:
— Use the buy and sell signals generated by the RSI crossing the Bollinger Bands as potential entry and exit points.
— Pay attention to divergences for additional confirmation of trend reversals.
3. Alerts:
— Set up alerts for buy and sell signals to receive notifications in real-time.
— Enable divergence alerts to be notified of potential trend reversals.
Conclusion
The RSI BB StdDev Signal Indicator is a comprehensive tool that combines the strengths of the RSI and Bollinger Bands to provide traders with more accurate and reliable signals. Whether you are a beginner or an experienced trader, this indicator can enhance your trading strategy by offering clear visual cues and customizable alerts.
Note
This indicator is provided with open-source code, allowing users to understand its logic and customize it further if needed. The detailed description and customizable settings ensure that traders of all levels can benefit from its unique features.

Divergence V2This indicator is based on the concept of divergence. I recommend that you find out and study about this yourself as the concept of divergence will not be explained in depth in this description.
This indicator will show divergences between the asset price and the RSI oscillator. The indicator will look for divergent points between the rising highs and falling lows of the asset; and the rising lows and falling highs of the RSI.
The trend of the asset tends to follow the behavior of the oscillator when a divergence occurs. So if we find a divergence between the two, the price of the asset is likely to follow the trend of the oscillator.
This indicator looks for these types of divergences and will show (based on the RSI) if there is a bullish or bearish divergence.
If it is bullish, it will show a line joining those points in green and if it is bearish in red. In addition, it will show a label where you can see the number of occurrences that have been found from a certain point to another.
Note: this indicator can be complemented with the “Divergence RSI V2” indicator which is also found in my library.
Settings
Backtesting Bars: is the number of bars back that the indicator will check. No more than 1000 is recommended as this will slow down the search.
Tolerance: number of times a divergent line can cross a bar. If you place 0, no bar can be crossed by a diverging line.
Min Bars To detect: will only search for divergences (or lines) that have the minimum number of bars selected in this option. Default option is 30.
Min Bars To detect: it will only search for divergences (or lines) that have the maximum number of bars selected in this option. Default option is 100.
Source Highs: The high points will be based on the close of each bar. You can use as another alternative.
Source Lows: The low points will be based on the close of each bar. You can use as another alternative.
Use squeeze parameter : only look for divergences (bullish or bearish) at times when such an indicator is in favor of the trend or coincides with the corresponding RSI divergence.

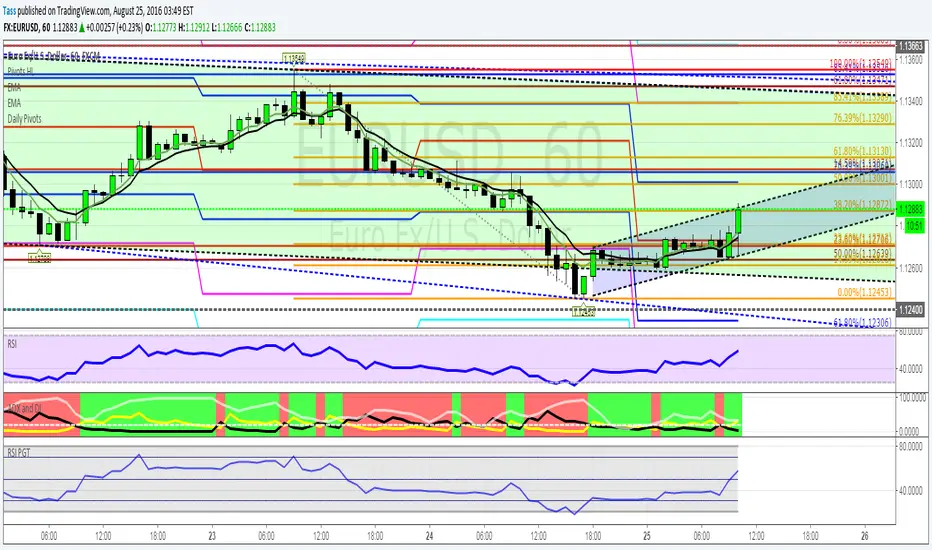
RSI Overbought/Oversold + Divergence IndicatorDESCRIPTION:
This script combines the Relative Strength Index ( RSI ), Moving Average and Divergence indicator to make a better decision when to enter or exit a trade.
- The Moving Average line (MA) has been made hidden by default but enhanced with an RSIMA cloud.
- When the RSI is above the selected MA it turns into green and when the RSI is below the select MA it turns into red.
- When the RSI is moving into the Overbought or Oversold area, some highlighted areas will appear.
- When some divergences or hidden divergences are detected an extra indication will be highlighted.
- When the divergence appear in the Overbought or Oversold area the more weight it give to make a decision.
- The same color pallet has been used as the default candlestick colors so it looks familiar.
HOW TO USE:
The prerequisite is that we have some knowledge about the Elliot Wave Theory, the Fibonacci Retracement and the Fibonacci Extension tools.
Wave 1
(1) When we receive some buy signals we wait until we receive some extra indications.
(2) On the RSI Overbought/Oversold + Divergence Indicator we can see a Bullish Divergence and our RSI is changing from red to green ( RSI is higher then the MA).
(3) If we are getting here into the trade then we need to use a stop loss. We put our stop loss 1 a 2 pips just below the lowest wick. We also invest maximum 50% of the total amount we want to invest.
Wave 2
(4) Now we wait until we see a clear reversal and here we starting to use the Fibonacci Retracement tool. We draw a line from the lowest point of wave(1) till the highest point of wave (1). When we are retraced till the 0.618 fib also called the golden ratio we check again the RSI Overbought/Oversold + Divergence Indicator. When we see a reversal we do our second buy. We set again a stop loss just below the lowest wick (this is the yellow line on the chart). We also move the stop loss we have set in step (3) to this level.
Wave 3
(5) To identify how far the uptrend can go we need to use the Fibonacci Extension tool. We draw a line from the lowest point of wave(1) till the highest point of wave (1) and draw it back to the lowest point of wave (2). Wave (3) is most of the time the longest wave and can go till it has reached the 1.618 or 2.618 fib. On the 1.618 we can take some profit. If we don't want to sell we move our stop loss to the 1 fib line (yellow line on the chart).
(6) We wait until we see a clear reversal on the Overbought/Oversold + Divergence Indicator and sell 33% to 50% of our investment.
Wave 4
(7) Now we wait again until we see a clear reversal and here we starting to use the Fibonacci Retracement tool. We draw a line from the lowest point of wave(2) till the highest point of wave (3). When we are retraced till the 0.618 fib also called the golden ratio we check again the RSI Overbought/Oversold + Divergence Indicator. When we see a reversal we buy again. We set again a stop loss just below the lowest wick (this is the yellow line on the chart).
(8) If we bought at the first reversal ours stop los was triggered (9) and we got out of the trade.
(9) If we did not bought at step (7) because our candle did not hit the 0.618 fib or we got stopped out of the trade we buy again at the reversal.
Wave 5
(10) To identify how far the uptrend can go we need to use the Fibonacci Extension tool. We draw a line from the lowest point of wave(2) till the highest point of wave (3) and draw it back to the lowest point of wave (4). Most of the time wave 5 goes up till it has reached the 1 fib. And that is the point where we got out of the trade with all of our investment. In this trade we got out of the trade a bit earlier. We received the sell signals and got a reversal on the Overbought/Oversold + Divergence Indicator.
We are hoping you learned something so you can make better decisions when to get into or out of a trade.
If you have any question just drop it into the comments below.
FEATURES:
• You can show/hide the RSI .
• You can show/hide the MA.
• You can show/hide the lRSIMA cloud.
• You can show/hide the Stoch RSI cloud.
• You can show/hide and adjust the Overbought and Oversold zones.
• You can show/hide and adjust the Overbought Extended and Oversold Extended zones.
• You can show/hide the Overbought and Oversold highlighted zones.
• Etc...
HOW TO GET ACCESS TO THE SCRIPT:
• Favorite the script and add it to your chart.
REMARKS:
• This advice is NOT financial advice.
• We do not provide personal investment advice and we are not a qualified licensed investment advisor.
• All information found here, including any ideas, opinions, views, predictions, forecasts, commentaries, suggestions, or stock picks, expressed or implied herein, are for informational, entertainment or educational purposes only and should not be construed as personal investment advice.
• We will not and cannot be held liable for any actions you take as a result of anything you read here.
• We only provide this information to help you make a better decision.
• While the information provided is believed to be accurate, it may include errors or inaccuracies.
Good Luck and have fun,
The CryptoSignalScanner Team

AMACD - All Moving Average Convergence DivergenceThis indicator displays the Moving Average Convergane and Divergence ( MACD ) of individually configured Fast, Slow and Signal Moving Averages. Buy and sell alerts can be set based on moving average crossovers, consecutive convergence/divergence of the moving averages, and directional changes in the histogram moving averages.
The Fast, Slow and Signal Moving Averages can be set to:
Exponential Moving Average ( EMA )
Volume-Weighted Moving Average ( VWMA )
Simple Moving Average ( SMA )
Weighted Moving Average ( WMA )
Hull Moving Average ( HMA )
Exponentially Weighted Moving Average (RMA) ( SMMA )
Symmetrically Weighted Moving Average ( SWMA )
Arnaud Legoux Moving Average ( ALMA )
Double EMA ( DEMA )
Double SMA (DSMA)
Double WMA (DWMA)
Double RMA ( DRMA )
Triple EMA ( TEMA )
Triple SMA (TSMA)
Triple WMA (TWMA)
Triple RMA (TRMA)
Linear regression curve Moving Average ( LSMA )
Variable Index Dynamic Average ( VIDYA )
Fractal Adaptive Moving Average ( FRAMA )
If you have a strategy that can buy based on External Indicators use 'Backtest Signal' which returns a 1 for a Buy and a 2 for a sell.
'Backtest Signal' is plotted to display.none, so change the Style Settings for the chart if you need to see it for testing.

RSI with Divergences, Reverse Formulas, and Bull/Bear ZonesRegular RSI indicator that can underline divergences, turn green or red specifying user specified bull/bear zones, and with a label showing the price needed to turn bull/bear!
Specify the inputs:
+ RSI Length
+ Bull Threshold
+ Bear Threshold
+ Panel Position Offset
Also with toggle-able:
+ Bullish Divergence
+ Bearish Divergence
+ Hidden Bullish Divergence
+ Hidden Bearish Divergence
The zones included in the indicator are default and not meant to be used for all markets. The goal is to alter the bull/bear zones to find good breakout points and selloff points for your chosen security. Does not currently support automatic zone creation, or saving zones for each security (if that is even possible, may just need to create different layouts for each security).
Thanks!

4x Stochastic Dingue4 Stochastic indicator into 1.
Different lengths produce short-term and long-term indicators that can help with finding the trend and impulses within the trend.
It can also find reversal points when all 4 are at the extreme at the same time. Ex. All 4 Stoch are above 90 or under 10 !! This could signal a bottom or top is soon to happen. (This is not always true as it depends on many factors.)
Many visual options make it even more customizable. Fill between Stoch, background colors, Crosses.
Divergences are not always accurate, depending on settings and timeframe, but they can be useful in certain situations.
---------------------
In closing, no indicator can give perfect signals, you need to use them in conjunction with other information to make better decisions.
I hope you like my indicators and that they help your trading.
If you have any questions please ask.
Thank you.

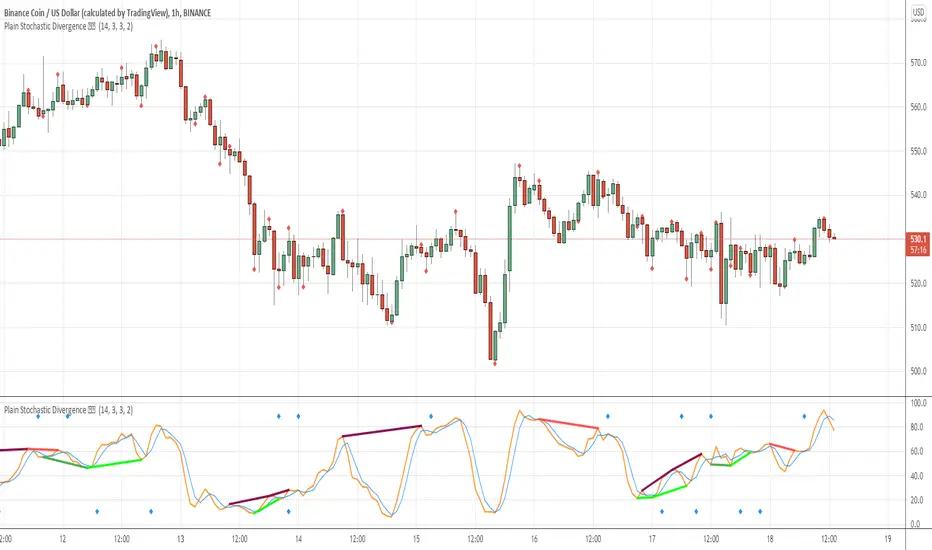
Plain Stochastic Divergence Stochastic Divergence
Plain simple way of calculating divergences
We all have times when we want to see just the divergences and nothning else
This script is minimalised to visualize that
references :
// stochastic // divergence // stoch //