Volume MAs Oscillator | Lyro RS// This Pine Script® code is subject to the terms of the Mozilla Public License 2.0 at mozilla.org
// © LyroRS
//@version=6
indicator("Volume MAs Oscillator | Lyro RS")
import LyroRS/LMAs/1 as DynamicMAs
//─────────────────────────────────────────────────────────────────────────────────────────────────────────────
//─██████─────────████████──████████─████████████████───██████████████───────████████████████───██████████████─
//─██░░██─────────██░░░░██──██░░░░██─██░░░░░░░░░░░░██───██░░░░░░░░░░██───────██░░░░░░░░░░░░██───██░░░░░░░░░░██─
//─██░░██─────────████░░██──██░░████─██░░████████░░██───██░░██████░░██───────██░░████████░░██───██░░██████████─
//─██░░██───────────██░░░░██░░░░██───██░░██────██░░██───██░░██──██░░██───────██░░██────██░░██───██░░██─────────
//─██░░██───────────████░░░░░░████───██░░████████░░██───██░░██──██░░██───────██░░████████░░██───██░░██████████─
//─██░░██─────────────████░░████─────██░░░░░░░░░░░░██───██░░██──██░░██───────██░░░░░░░░░░░░██───██░░░░░░░░░░██─
//─██░░██───────────────██░░██───────██░░██████░░████───██░░██──██░░██───────██░░██████░░████───██████████░░██─
//─██░░██───────────────██░░██───────██░░██──██░░██─────██░░██──██░░██───────██░░██──██░░██─────────────██░░██─
//─██░░██████████───────██░░██───────██░░██──██░░██████─██░░██████░░██───────██░░██──██░░██████─██████████░░██─
//─██░░░░░░░░░░██───────██░░██───────██░░██──██░░░░░░██─██░░░░░░░░░░██───────██░░██──██░░░░░░██─██░░░░░░░░░░██─
//─██████████████───────██████───────██████──██████████─██████████████───────██████──██████████─██████████████─
//─────────────────────────────────────────────────────────────────────────────────────────────────────────────
// LyroRS v1.0
// Groups
ma_g = "𝗠𝗢𝗩𝗜𝗡𝗚 𝗔𝗩𝗘𝗥𝗔𝗚𝗘"
bands_g = "𝗕𝗔𝗡𝗗"
display_g = '𝗗𝗜𝗦𝗣𝗟𝗔𝗬'
// Inputs
// -- Moving Average
source = input.source(close, "Source", group= ma_g, tooltip= "Select where the data originates (open, high, low, close, etc..).")
ma_type = input.string("EMA", "Select Moving Average", options= , group=ma_g, tooltip="Choose a moving average type to apply to the price multiplied by volume. VWMA already incorporates volume directly.")
ma_length = input.int(30, "Moving Average Length", group= ma_g, tooltip= "Defines the length or period of the selected moving average.")
// -- Bands
band_length = input.int(27, "Band Length", group=bands_g, tooltip="Number of bars used to calculate standard deviation.")
band_smoothing = input.float(0.8, "Band Smoothing", group=bands_g, minval=0, tooltip="Smooths the band edges to reduce noise.")
pbm = input.float(1.8, "Positive Band Multiplier", group=bands_g, minval=0, tooltip="Multiplier for the upper band distance.")
nbm = input.float(-0.85, "Negative Band Multiplier", group=bands_g, maxval=0, tooltip="Multiplier for the lower band distance.")
// Color Inputs
signal_type = input.string("Trend", "Select Signal Type", options= , group=display_g, tooltip="Select which way to use the indicator.")
ColMode = input.string("Mystic", "Custom Color Palette", inline="drop", options= , display=display.none, group= display_g, tooltip="Select a predefined color scheme for the indicator display. (Major Themes color mode automatically switches colors based on the major asset you picked for valuation analysis.)")
cpyn = input.bool (true, "Use Custom Palette", group= display_g, display=display.none, tooltip="Enables custom color selection for signals.")
cp_UpC = input.color (#00ff00, "Custom Up", inline = "Custom Palette", group= display_g, display=display.none, tooltip="")
cp_DnC = input.color (#ff0000, "Custom Down", inline = "Custom Palette", group= display_g, display=display.none, tooltip="User specifed bullish and bearish colors.")
d_obos_sigs = input.bool (true, "Display Oversold/Overbought Signs", group= display_g, display=display.none, tooltip="Enables triangle signs to be displayed.")
d_signs = input.bool (true, "Display Signs", group= display_g, display=display.none, tooltip="Enables signs for Trend mode.")
d_bgcol = input.bool (true, "Display Background Color", group= display_g, display=display.none, tooltip="Enables background color for Reversion & Valuation mode.")
// Colors
color UpC = na
color DnC = na
// -- Predefined Colors
switch ColMode
"Classic" =>
UpC := #00E676
DnC := #880E4F
"Mystic" =>
UpC := #30FDCF
DnC := #E117B7
"Accented" =>
UpC := #9618F7
DnC := #FF0078
"Royal" =>
UpC := #FFC107
DnC := #673AB7
// -- Custom Colors
if cpyn
UpC := cp_UpC
DnC := cp_DnC
// Coloring Function for Valuation
coloring(src) =>
color.from_gradient(src, ta.lowest(src, band_length), ta.highest(src, band_length), UpC, DnC)
// Moving Average Switch
float ma = na
switch ma_type
"SMA" => ma := DynamicMAs.SMA(source * volume, ma_length) / DynamicMAs.SMA(volume, ma_length)
"EMA" => ma := DynamicMAs.EMA(source * volume, ma_length) / DynamicMAs.EMA(volume, ma_length)
"WMA" => ma := DynamicMAs.WMA(source * volume, ma_length) / DynamicMAs.WMA(volume, ma_length)
"VWMA" => ma := DynamicMAs.VWMA(source, volume, ma_length) // Already Volume Based MA
"DEMA" => ma := DynamicMAs.DEMA(source * volume, ma_length) / DynamicMAs.DEMA(volume, ma_length)
"TEMA" => ma := DynamicMAs.TEMA(source * volume, ma_length) / DynamicMAs.TEMA(volume, ma_length)
"RMA" => ma := DynamicMAs.RMA(source * volume, ma_length) / DynamicMAs.RMA(volume, ma_length)
"HMA" => ma := DynamicMAs.HMA(source * volume, ma_length) / DynamicMAs.HMA(volume, ma_length)
"LSMA" => ma := DynamicMAs.LSMA(source * volume, ma_length, 0) / DynamicMAs.LSMA(volume, ma_length, 0)
"SMMA" => ma := DynamicMAs.SMMA(source * volume, ma_length) / DynamicMAs.SMMA(volume, ma_length)
"ALMA" => ma := DynamicMAs.ALMA(source * volume, ma_length, 0, 20) / DynamicMAs.ALMA(volume, ma_length, 0, 20)
"ZLSMA" => ma := DynamicMAs.ZLSMA(source * volume, ma_length) / DynamicMAs.ZLSMA(volume, ma_length)
"FRAMA" => ma := DynamicMAs.FRAMA(source * volume, ma_length) / DynamicMAs.FRAMA(volume, ma_length)
"KAMA" => ma := DynamicMAs.KAMA(source * volume, ma_length) / DynamicMAs.KAMA(volume, ma_length)
"JMA" => ma := DynamicMAs.JMA(source * volume, ma_length, 0) / DynamicMAs.JMA(volume, ma_length, 0)
"T3" => ma := DynamicMAs.T3(source * volume, ma_length, 0.5) / DynamicMAs.T3(volume, ma_length, 0.5)
price_diff = ((source - ma) / ma) * 100 // Percentage Difference between Source and the Moving Average of the source
// Calculations for the Bands
std = ta.stdev(price_diff, band_length)
upperBandRaw = std * pbm
lowerBandRaw = std * nbm
var float upperBand = na
var float lowerBand = na
// Smooth
upperBand := upperBandRaw * band_smoothing + nz(upperBand ) * (1 - band_smoothing)
lowerBand := lowerBandRaw * band_smoothing + nz(lowerBand ) * (1 - band_smoothing)
// Plot Color
var color pc = na
var color uB_color = na
var color lB_color = na
var int signal = 0
if signal_type == "Trend"
uB_color := UpC
lB_color := DnC
if price_diff > upperBand
pc := UpC
signal := 1
if price_diff < lowerBand
pc := DnC
signal := -1
if signal_type == "Reversion"
uB_color := DnC
lB_color := UpC
if price_diff > upperBand
pc := DnC
signal := -1
else if price_diff < lowerBand
pc := UpC
signal := 1
else
pc := color.gray
signal := 0
if signal_type == "Valuation"
uB_color := UpC
lB_color := DnC
pc := coloring(price_diff)
// Plot
plot(price_diff, color= pc, linewidth = 2, title= "Volume MAs Oscillator")
plot(upperBand, color= color.new(uB_color, 50), title= "Upper Band")
plot(lowerBand, color= color.new(lB_color, 50), title= "Lower Band")
plot(0, color= color.new(pc, 60), linewidth = 2, display= display.pane, title= "Mid Line")
plot(0, color= color.new(pc, 75), linewidth = 5, display= display.pane, title= "Mid Line Glow 1")
plot(0, color= color.new(pc, 85), linewidth = 10, display= display.pane, title= "Mid Line Glow 2")
plotchar(upperBand + 0.5, char='▼', color= ta.crossunder(price_diff, upperBand) ? DnC : na, location=location.absolute, title= "Overbought Signal", display= d_obos_sigs ? display.pane : display.none, size= size.tiny)
plotchar(lowerBand - 0.5, char='▲', color= ta.crossover(price_diff, lowerBand) ? UpC : na, location=location.absolute, title= "Oversold Signal", display= d_obos_sigs ? display.pane : display.none, size= size.tiny)
reversion_enable = signal_type == "Reversion"
valuation_enable = signal_type == "Valuation"
bgcolor(d_bgcol and ((valuation_enable and price_diff > upperBand) or (reversion_enable and ta.crossunder(price_diff, upperBand))) ? color.new(DnC, 85) : na, title= "BG Color OB")
bgcolor(d_bgcol and ((valuation_enable and price_diff > upperBand) or (reversion_enable and ta.crossunder(price_diff, upperBand))) ? color.new(DnC, 85) : na, title= "BG Color OB Overlay", force_overlay = true)
bgcolor(d_bgcol and ((valuation_enable and price_diff < lowerBand) or (reversion_enable and ta.crossover(price_diff, lowerBand))) ? color.new(UpC, 85) : na, title= "BG Color OS")
bgcolor(d_bgcol and ((valuation_enable and price_diff < lowerBand) or (reversion_enable and ta.crossover(price_diff, lowerBand))) ? color.new(UpC, 85) : na, title= "BG Color OS Overlay", force_overlay = true)
plotshape(ta.crossover(signal, 0), title="Buy Signal", location=location.belowbar,
style=shape.labelup, text="𝓛𝓸𝓷𝓰", textcolor=#000000, size=size.small,
color=UpC, force_overlay=true, display= signal_type == "Trend" and d_signs == true ? display.pane : display.none)
plotshape(ta.crossunder(signal, 0), title="Sell Signal", location=location.abovebar,
style=shape.labeldown, text="𝓢𝓱𝓸𝓻𝓽", textcolor=#000000, size=size.small,
color=DnC, force_overlay=true, display= signal_type == "Trend" and d_signs == true ? display.pane : display.none)
plotcandle(open, high, low, close, color= pc, wickcolor = pc, bordercolor = pc, force_overlay = true, display= display.pane, title= "Plot Candle")
barcolor(pc, title= "Barcolor")
// ==========================================================================================
// === Dashboard with Telegram Link ===
var table myTable = table.new(position.top_center, 1, 1, border_width=1, frame_color=color.black, bgcolor=color.white)
// Add Telegram Message to Dashboard
table.cell(myTable, 0, 0, "Join Telegram @mrexpert_ai", bgcolor=color.blue, text_color=color.white, text_size=size.normal)
Indicateurs Bill Williams

Borna's Zones NY Borna's Zones marks two important time-based zones on the chart: the 08:00 zone and the 09:00 zone.
The 14:00 zone identifies initial liquidity. This zone sets the range where early market participants create significant activity.
The 15:00 zone serves as a reference for confirmation. After 15:00, the indicator helps you identify whether the 14:00 zone should be considered cleared.
Both zones are automatically extended until 17:00, providing clear visual references for potential market reactions.
No trading is recommended after 17:00, as the early morning zones lose relevance.
This indicator is useful for traders who focus on pre-market and early session liquidity, helping to visualize key levels where price may react.

MAX TRADE (PRO)MAX TRADE (PRO) is a professional-grade TradingView indicator designed to deliver clean, high-quality BUY/SELL signals with a premium visual layout and clear risk management on the chart.

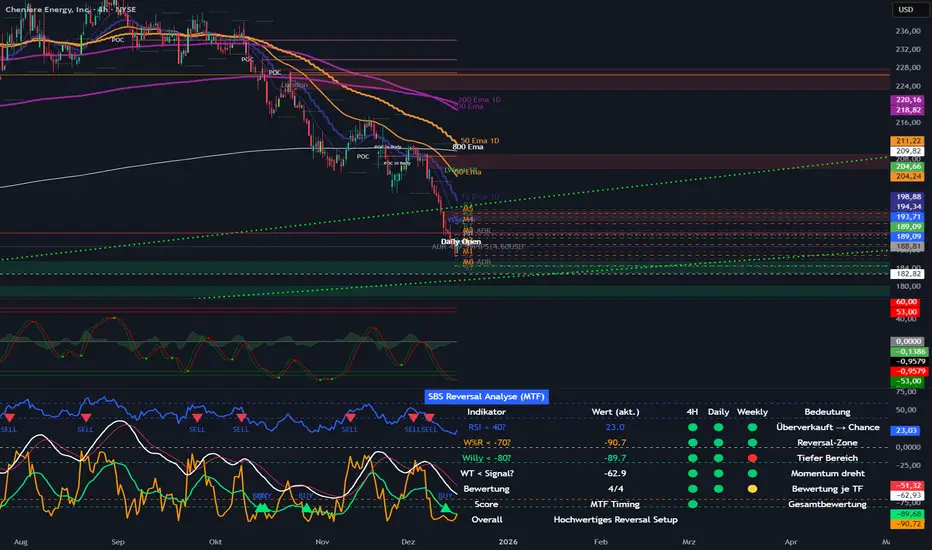
SBS Reversal Engine MTFSBS Reversal Engine (MTF) is a professional multi-timeframe indicator designed to identify high-quality reversal zones across stocks, crypto, and indices.
It combines RSI, Williams %R, a smoothed Williams oscillator ("Willy"), and a proprietary WaveTrend momentum filter to evaluate market conditions across 4H, Daily, and Weekly timeframes.
A visual traffic-light system provides a clear overview of oversold conditions, momentum shifts, and multi-timeframe alignment.
The integrated MTF Score System helps traders focus on high-quality setups where market structure, context, and timing align.
This indicator is an analytical tool and does not constitute financial advice.
© Step Buy Step 2025 – All rights reserved
SMC Market Structure with EMA Confirmation and Prepare EntryDewaSMC v1 — Smart Market Structure with Prepare Entry & EMA Confirmation
DewaSMC v1 is a technical analysis indicator based on market structure concepts, designed to help traders visually analyze price behavior in a structured and objective way. This indicator focuses on identifying structural changes in the market and highlighting areas of interest where price reactions may occur.
It is intended as an analytical support tool, not as an automated trading system or a signal service
🔹 Key Features
1. Market Structure Detection (BOS & CHoCH)
• Identifies Break of Structure (BOS) and Change of Character (CHoCH) using swing high and swing low analysis.
• Break confirmation can be configured to use candle body or wick.
• Structure levels are visualized with lines and clear BOS / CHoCH labels directly on the chart.
2. Prepare Entry Zones
• Displays prepare entry zones when price approaches an important structure level but has not yet confirmed a break.
• These zones help users monitor potential setups without entering prematurely.
• Prepare zones are temporary and automatically disappear after a defined number of bars or once a structure break occurs.
3. EMA Confirmation Filter
• Uses short-term and long-term EMAs as directional filters.
• Optional confirmation modes:
o Price relative to EMA
o EMA alignment (short EMA above/below long EMA)
• This filter is designed to reduce counter-structure or counter-trend scenarios.
4. Volatility-Based Target Projection
• After a confirmed structure break, the indicator projects:
o Entry level
o Stop Loss level
o Multiple target levels (TP1, TP2, TP3)
• Targets are calculated using ATR-based volatility logic, allowing adaptability to different market conditions.
• Risk and reward areas are displayed as visual zones for clarity.
5. Trade Information Table
• A real-time information table summarizes key analytical data, including:
o Structural direction
o Entry level
o Stop Loss
o Target levels
o EMA confirmation status
o Estimated Risk-to-Reward ratio
• Table position is fully customizable on the chart.
6. Trend Visualization
• Candles can be colored based on current market structure direction.
• EMAs are plotted as additional trend references.
⚙️ Customizable Settings
• Structure detection period
• Break confirmation type (Body or Wick)
• Enable / disable:
o Prepare Entry zones
o EMA confirmation
o Trade information table
o Trend-based candle coloring
• Visual customization options for colors and layout
📌 Important Notes
• This indicator does not provide financial advice and does not guarantee any specific outcome.
• It should be used in combination with:
o Personal risk management rules
o Additional technical or contextual analysis
• All trading decisions remain the responsibility of the user.
🎯 Suitable For
• Traders studying market structure or Smart Money–style concepts
• Manual analysis on various instruments and timeframes
• Users seeking a structured and visual approach to price analysis

ORB Algo⚡ ORB Strategy + Backtesting (Pine Script v5)
This script implements a complete Opening Range Breakout (ORB) strategy, featuring built-in backtesting, advanced TP/SL visualization, full style customization, and a performance dashboard. It is designed for traders who want to clearly evaluate breakout performance directly on the chart.
🕑 ORB Window Configuration
🔹 Session selection: choose between Market Timezone or Custom Session.
🔹 Timezone support: configurable from UTC-8 to UTC+12.
🔹 Daily limit: option to allow only one trade per day.
🔹 Risk/Reward (RR) settings:
Configurable TP1, TP2, and TP3 levels.
Stop Loss calculated dynamically from the ORB range.
📊 Backtesting Engine
🔹 Interactive dashboard showing trades, wins, losses, and win rate.
🔹 Adjustable partial exits for each TP (TP1, TP2, TP3).
🔹 Automatic calculation of percentage-based profit and loss.
🔹 Tracks total trades, total profit, and average profit per trade.
🎨 Visual Customization
🔹 Fully customizable colors:
ORB high/low lines and range fill.
Buy/Sell entry labels.
TP and SL lines with background zones.
🔹 Line style and thickness options (solid, dotted, dashed).
🔹 Visibility controls for each TP/SL level.
🔹 Clear profit and loss zones drawn directly on the chart.
🚀 Trading Logic
🔹 LONG entries: triggered when price breaks above the ORB high.
🔹 SHORT entries: triggered when price breaks below the ORB low.
🔹 Automatic calculation of Stop Loss and TP1, TP2, TP3 based on ORB range and RR.
🔹 Customizable BUY / SELL labels displayed at entry.
✅ TP / SL Detection
🔹 Real-time detection of TP1, TP2, TP3, and SL hits.
🔹 Prevents double counting of the same level.
🔹 Extended TP/SL lines with shaded zones for better clarity.
📈 Backtesting Dashboard
🔹 Displayed in the top-right corner of the chart.
🔹 Shows:
Total trades
Wins / Losses
Win rate (%)
Total profit (%)
Average profit per trade
🔹 Fully customizable panel color.
✨ Summary
This script combines:
Opening Range detection
Breakout trading logic with advanced risk management
Professional-grade visualizations
Integrated historical performance tracking
High customization for sessions, styles, and colors
💡 Ideal for traders who want to trade ORB setups with clarity, structure, and measurable results.


Volume Orderblock Breakout v3.6this is indicator that shows long short siganl and tp lines can be checked.
you can get profit by this forever.
we can win over whales
keep going don't give up!!!

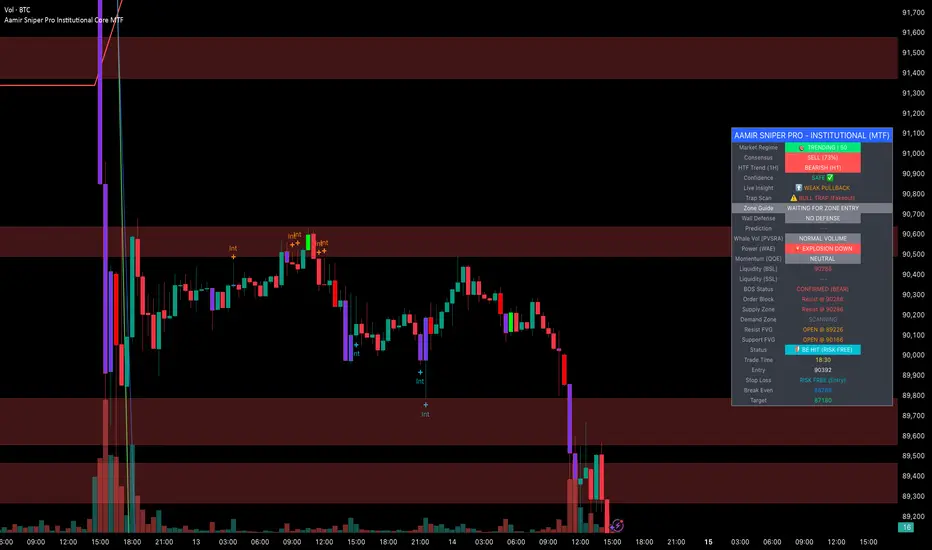
Aamir Sniper Pro Institutional Core MTFConcept & Utility: This script is a comprehensive "Multi-Factor Confluence System" designed to filter out market noise by requiring agreement between Trend, Momentum, Volatility, and Market Structure before generating a signal.
Many traders struggle with false signals generated by single indicators. This script solves that problem by using a Consensus Engine. Instead of relying on just one moving average or oscillator, this script aggregates data from over 20 different technical methods. It then applies strict filters (WAE, ADX, and MTF) to ensure that trades are only suggested during high-probability market conditions.
How the Components Work Together:
1. The Consensus Engine (The Core Logic): At the heart of the script is a voting system. It calculates the slope and direction of:
Fast/Slow EMAs, SMAs, WMAs, and Hull MA.
Ichimoku Cloud (Baseline/Conversion line).
SuperTrend and Parabolic SAR.
Oscillators (RSI, Stochastic, CCI).
Result: It generates a "Consensus Score" (0-100%). A signal is ONLY considered if the Bullish or Bearish score exceeds the user-defined threshold (Default: 70%).
2. The Filtering Layers (Why this is not just a mashup): A high consensus score alone is not enough. The script validates the signal through three mandatory filters:
Volatility Filter (WAE): Uses Waddah Attar Explosion logic to ensure there is enough volume/power to sustain the move.
Regime Filter (ADX): Checks the Average Directional Index. If the market is choppy (ADX < 25), the signal is blocked to prevent whipsaws.
MTF Filter: Checks the trend on a Higher Timeframe (Default: 1 Hour). It forces the user to trade only in the direction of the dominant trend.
3. Structural Context (SR Zones): We have integrated Dynamic Support & Resistance Zones based on Pivot Points.
Purpose: This provides immediate structural context. Even if the Consensus Engine gives a "BUY" signal, the trader can see if price is currently sitting at a "Resistance Box." This visual aid prevents buying into supply or selling into demand.
4. Institutional Volume (PVSRA): Candles are colored based on Volume Spread Analysis (PVSRA) concepts.
Purple/Blue Candles: Indicate "Whale Activity" (Volume > 200% of average). This helps confirm if institutional money is backing the move identified by the Consensus Engine.
5. Momentum Confirmation (QQE): The Qualitative Quantitative Estimation (QQE) is displayed on the dashboard to confirm short-term momentum direction, acting as the final trigger.
Features:
Sniper Mode: Option to wait for a candle retest before entry.
Dashboard: Displays the live Consensus Score, Market Regime, and Trend Status.
Risk Management: Auto-calculates SL/TP based on Swing High/Low or ATR.
Credits & Attribution:
WAE Logic: Adapted from the work of Waddah Attar.
PVSRA: Volume concepts adapted from the Traderathome/PVSRA community.
QQE: Adapted from standard open-source logic.
SR Zones: Logic derived from standard Pivot Point calculations.
Programmers Toolbox of ta LibraryA programmer's "Swiss army knife" for selecting functions from the " ta Library by Trading View " during coding. Illustrates the results of the individual library functions. Adds a few extra features. Extensively and uniquely documented.

AJ Super Blast SignalsPrice action trading script suited for all TF, it will work on all instruments NIFTY/ BANK NIFTY/COMMODITY/SENSEX/ MIDCAP NIIFTY AND CRYPTOCURRENCY....IT HELPS TO AVOID SIDEWAYS MARKET SIGNALS WHICH PREVIOUS SCRIPTS DOESNT DO

XAUUSD [MAX]XAUUSD (Gold) M1 indicator based on Support/Resistance (pivot S/R) + classic price action confirmation.
• Designed for XAUUSD on the 1-minute timeframe
• Alternating signals only: BUY → SELL → BUY → SELL
• No new signal while a trade is active (waits until TP or SL is hit)
• Fixed targets: SL = 20 pips, TP = 100 pips (pipSize adjustable in settings)
• Filters: EMA trend + optional RSI filter + S/R touch logic
Note: This script is for educational/testing purposes. Always use proper risk management.

Ahmed Gold Signals - 5M LIVE (Frequent)📈 Gold (XAUUSD) Trading Signals – Precision-Based Strategy
Our Gold signals are built on pure price action, not random indicators or guesswork.
🔍 How our signals are generated
We focus on:
🧲 Liquidity Sweeps
Identifying when price grabs stop-losses above highs or below lows and then reverses
📊 Clear trend direction using EMA 50 & EMA 200
✅ Strong confirmation candles after the sweep
🎯 Entries only in the direction of the trend to increase accuracy
🔵 BUY Signals
Bullish market structure
Price sweeps liquidity below recent lows
Strong bullish confirmation candle closes
➡️ High-probability BUY setup
🔴 SELL Signals
Bearish market structure
Price sweeps liquidity above recent highs
Strong bearish confirmation candle closes
➡️ High-probability SELL setup
⏱️ Timeframe
5-minute chart (5M)
Fast, precise signals ideal for scalping Gold
🛡️ Risk Management
Stop loss placed beyond the liquidity sweep
Clear take-profit targets
Risk-to-reward typically 1:2 or better
⚠️ Important Notes
We do not trade every move
We wait for confirmation
Quality over quantity — always


MAJOR PA Zones + Structure + Targets (Gray/Purple)This script highlights major price-action structure (HH/HL/LH/LL), marks BOS/CHOCH events, and draws key supply/demand zones to help visualize trend shifts and potential targets.

CM Indicator매매에 중요한 여러 지표를 묶어 7개로 만들었습니다.
단기 매매라면 7번째 거래량 지표가 중요하며 손절가 익절가는
모든 지표를 켜셔서 확인하시면 좋습니다
Several important indicators for trading were grouped into seven.
If it's a short-term trade, the 7th volume indicator is important, and the sell-off price is
You can check all the indicators by turning them on

RSI Multi-Timeframe TableHow the RSI Multi-Timeframe Table Indicator Works
This indicator displays a table showing the RSI (14) from multiple timeframes at the same time.
It helps you quickly see whether the RSI is in overbought or oversold zones across different periods (1m, 5m, 15m, 30m, 1h, 4h, and 1D).
Below is a clear explanation of how each part works:
1) Timeframes Used
The indicator analyzes the RSI from the following timeframes:
1 minute (1m)
5 minutes (5m)
15 minutes (15m)
30 minutes (30m)
1 hour (1h)
4 hours (4h)
1 day (1D)
Each row of the table represents one of these timeframes.
2) How the RSI Is Retrieved
For each timeframe, the script uses the request.security() function to fetch the RSI(14) value from that specific timeframe, even if your current chart is set to a different one.
Example: On a 1h chart, you can still see the RSI from 1m, 5m, 30m, etc.
3) Table Structure
The table appears in the top-right corner and contains 8 columns:
TF – shows the timeframe name
RSI – shows the RSI value with two decimal places
10 – marks if RSI is ≤ 10
20 – marks if RSI is ≤ 20
30 – marks if RSI is ≤ 30
70 – marks if RSI is ≥ 70
80 – marks if RSI is ≥ 80
90 – marks if RSI is ≥ 90
The extreme levels (10, 20, 80, 90) help identify possible reversal zones.
4) Markings in the Table
When a condition is true, a ● circle appears in the corresponding cell.
Examples:
If the 5m RSI is ≤ 20, a circle appears in the 20 column for the 5m row.
If the 1H RSI is ≥ 80, a circle appears in the 80 column for the 1H row.
Colors also help interpretation:
Red for strong oversold levels (≤10)
Orange and yellow for intermediate levels
Green, teal, and blue for overbought levels
5) Alerts
The indicator includes four built-in alerts:
RSI ≤ 10
RSI ≤ 20
RSI ≥ 80
RSI ≥ 90
These alerts use the RSI from the current chart timeframe.
To enable them:
Open Alerts in TradingView
Click Create Alert
Select the indicator
Choose the alert you want
Confirm
6) Purpose of This Indicator
It is useful for:
Quickly checking market strength across multiple timeframes
Identifying when several periods are overbought or oversold
Avoiding trades against market momentum
Helping confirm potential reversal points
Summary
This indicator creates a table that shows RSI values from multiple timeframes and visually highlights overbought or oversold conditions in each one.
It also includes ready-to-use alerts for the most extreme RSI levels.

DR/IDR, fractals, break + EMA Clouds + VWAPThis indicator is a powerful, multi-layered trading tool that combines three distinct forms of market analysis—volume, trend, and opening volatility—onto a single chart.
1. Opening Range Breakout (ORB) System
This is the foundation of the indicator, designed to capture the initial volatility and set key price boundaries for the trading day.
Time Focus: The indicator's primary analysis is centered on a specific, user-defined time period (default is 9:30 AM to 10:30 AM New York Time). Nothing related to the ORB drawing will appear on the chart before this session starts.
Wick High/Low (The Trigger): These lines track the absolute highest and lowest prices reached during the time window. They define the full extent of the initial range and are used to determine when a genuine breakout occurs.
Body High/Low (The Range & Targets): These lines track the highest and lowest open/close prices of the candles within the session. This area forms the central, shaded zone, representing the core consolidation area.
Range Shading: The background between the Body High and Body Low is shaded, but this visual feature only appears during the active forming time window (e.g., 9:30 AM to 10:30 AM) to maintain chart clarity.
Fractals: While the range is forming, the indicator detects 5-bar Williams Fractal patterns that occur inside the range. These small triangles (▲ or ▼) highlight minor reversal points established by the early trading action.
Breakout Signal: After the user-defined time window closes, the indicator waits. If a subsequent candle's price moves above the Wick High or below the Wick Low, a "BREAK" label is displayed on that candle. It is programmed to label only the first decisive break in each direction per day.
Extension Targets: When a breakout occurs, target lines are automatically projected above the Body High (for a bullish break) or below the Body Low (for a bearish break). The distance between these targets is calculated based on a user-defined fraction (e.g., 0.5 steps) of the total height of the Body Range.
Line Cutoff: For tidiness, you can set a "Stop Time" (e.g., 4:00 PM) after which the ORB lines will automatically disappear.
2. EMA Clouds (Trend and Momentum)
Four distinct Exponential Moving Average (EMA) clouds are plotted to provide a dynamic, multi-speed view of the market's trend and momentum.
Structure: Each "Cloud" is the shaded area between two EMAs (one shorter length and one longer length). The indicator includes four customizable pairs (defaulting to common settings like 8/9, 8/14, 34/50, and 14/21).
Trend Coloring: The clouds are color-coded:
Bullish (Greenish): The shorter EMA is trading above the longer EMA, signaling upward momentum.
Bearish (Reddish): The shorter EMA is trading below the longer EMA, signaling downward momentum.
Application: These clouds are used to confirm the overall market direction or identify potential zones of support and resistance.
3. Volume-Weighted Average Price (VWAP)
The VWAP is a crucial anchor for measuring the market's efficiency throughout the trading day.
Function: It calculates the average price of the asset, giving more weight to prices where higher volume was traded.
Context: It helps traders quickly determine if the current price is trading at a premium (above VWAP) or a discount (below VWAP) relative to the day's volume.
Reset: The VWAP line automatically resets at the beginning of each trading day.
Customization: The VWAP line can be toggled on or off, and its color and width are fully adjustable.

DR/IDR fractals break candle (ChadAnt)This indicator is an Opening Range Breakout (ORB) tool. It identifies the high and low price range established during a specific time window (e.g., the first hour of trading, 9:30–10:30 AM NY time). Once that time window closes, it watches for the price to "break out" of that range and projects profit targets based on the size of the initial range.
Key Features & How They Work
1. The Opening Range (The Box)
Time Window: The indicator waits for your specific start time (default 9:30 AM NY). It does not draw anything before this time.
The "Wicks": It tracks the absolute highest and lowest prices reached during this time (the Wicks). These act as your Breakout Triggers.
The "Body": It tracks the highest and lowest candle closes/opens during this time. This creates a shaded "zone" on your chart, representing the core area where most trading occurred.
Shading: To keep your chart clean, the background shading only appears during the forming time window.
2. Breakout Signals
Once the time window ends (e.g., 10:30 AM), the indicator "locks" the levels.
It then waits for a candle to move above the Wick High or below the Wick Low.
The Signal: When this happens, a label ("BREAK") appears on the chart.
Green Label: Bullish breakout (price went above the range).
Red Label: Bearish breakout (price went below the range).
Note: It only signals the first breakout of the day to avoid false alarms during choppy markets.
3. Extension Targets (Profit Levels)
When a breakout signal occurs, the indicator automatically draws target lines (extensions).
Calculation: These targets are based on the height of the "Body" zone (the shaded area).
Example: If your setting is 1.0, the indicator measures the height of the shaded body range and projects that exact distance above the breakout point. This is often used as a "Measured Move" target.
You can customize how many lines appear and how far apart they are (e.g., 0.5, 1.0, 1.5 times the range size).
4. Williams Fractals
During the opening range time, the indicator looks for specific price patterns called "Williams Fractals" (a 5-candle pattern that highlights potential turning points).
If a fractal peak or valley occurs inside your opening range, it marks it with a small triangle (▲ or ▼). Traders often use these as early signs of support or resistance forming inside the range.
5. Clean Visuals
Line Cutoff: You can set a "Stop Time" (e.g., 16:00 or 4:00 PM). The lines will stop drawing at that time so they don't clutter your chart overnight.
Gap Handling: The lines are programmed to break cleanly between days, so you don't see messy diagonal lines connecting yesterday's close to today's open.
Summary of Settings You Can Change
Session Time: When the range starts and ends.
Line Stop Time: When the lines should disappear for the day.
Visuals: Colors, line width, and style (solid, dotted, dashed).
Extensions: How many target lines to draw and the step size (e.g., 0.5x, 1.0x).
Fractals: Toggle the triangle icons on/off.

Volume Surge - First Candle Break (v6)thisisavolumesurgeindicator will help with trading. use it to identify on 5 minutes
thisisavolumesurgeindicator will help with trading. use it to identify on 5 minutes
thisisavolumesurgeindicator will help with trading. use it to identify on 5 minutes

Terils 1hr HTF EMA Add-On EMA 50/100its EMA 50 and EMA 100 in 1 her time frame.
its EMA 50 and EMA 100 in 1 her time frame.
its EMA 50 and EMA 100 in 1 her time frame.
its EMA 50 and EMA 100 in 1 her time frame.
its EMA 50 and EMA 100 in 1 her time frame.
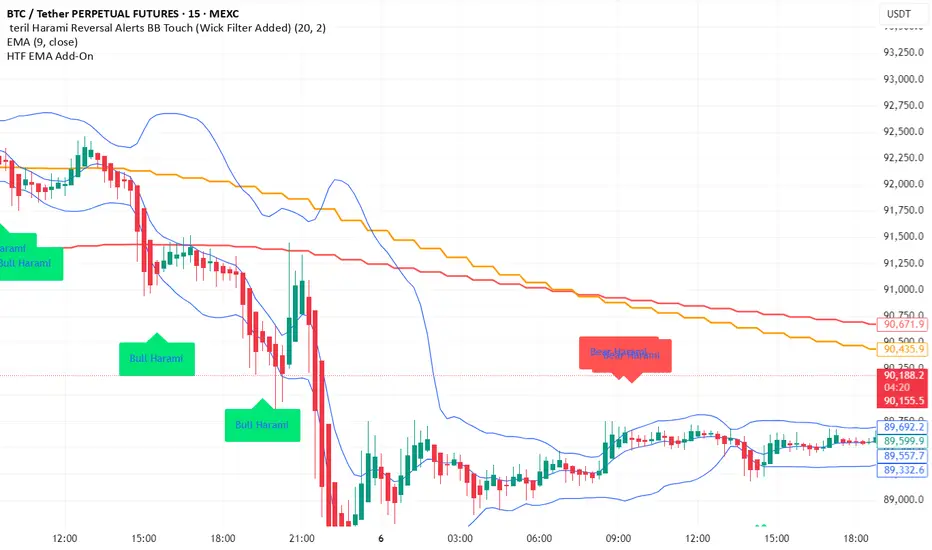
LETHINH Pinbar📌 PinBar Minimal Detector — Description (English)
PinBar Minimal Detector is a clean and efficient tool designed to detect high-quality pin bars based purely on candle geometry.
This script focuses on the core characteristics of a true pin bar: a long rejection wick and a small candle body, without adding unnecessary complexity. It is ideal for traders who want fast, reliable signal detection without noise.
⸻
✨ Key Features
• Detects both bullish and bearish pin bars.
• Fully configurable wick/body ratio.
• Optional filter for maximum opposite wick size.
• Option to ignore candles with extremely small bodies.
• Clean chart display with simple labels (“PIN”).
• Includes alert conditions for automated notifications (webhook, popup, email, etc.).
• Lightweight and optimized for fast execution on any timeframe.
⸻
🔍 Detection Logic
A candle qualifies as a bullish pin bar when:
• The lower wick is at least X times larger than the body.
• The upper wick is relatively small (optional filter).
• The body is above the minimum body threshold.
A candle qualifies as a bearish pin bar when:
• The upper wick is at least X times larger than the body.
• The lower wick is relatively small.
• The body meets the minimum size requirement.
This ensures that only candles showing strong rejection are highlighted.
⸻
⚙️ Input Parameters
1. wick/body ratio
Defines how many times longer the main wick must be compared to the candle body.
For example:
• 3.0 → wick must be at least 3× the body
• 4.0–5.0 → only very strong pin bars
2. opposite wick max (factor)
The maximum allowed size of the wick on the opposite side, relative to the body.
Example:
• 0.5 → opposite wick ≤ 50% of body
• Lower values = stricter filtering
3. min body px
Filters out candles with bodies that are too small (low volatility candles).
4. show labels
Enable or disable the “PIN” labels on the chart.
⸻
🚨 Alerts
The script includes two built-in alert conditions:
• Bullish PinBar Detected
• Bearish PinBar Detected
These alerts can be paired with:
• TradingView notifications
• Webhooks (for bots / automation)
• Email or SMS alerts
⸻
🎯 Use Cases
• Identify high-probability reversal points
• Enhance price action strategies
• Combine with S/R zones, supply & demand, trendlines, or order blocks
• Filter entries on lower timeframes while following higher-timeframe trend bias
⸻
📘 Notes
This is a minimalistic version by design.
If you want a more advanced version (confirmation candle, volume filter, multi-timeframe filtering, trend direction filtering, etc.), this script can be expanded easily

智能趋势-多周期动态信号 Smart Trend Oscillator MTF V1🚀 智能趋势-多周期动态信号 Smart Trend Oscillator MTF V1
—— 让交易像红绿灯一样简单直观 | Making Trading as Simple as Traffic Lights
告别复杂的参数设置,把市场噪音变成明确的信号。 Say goodbye to complex parameters. Turn market noise into clear signals.
🌟 它是做什么的? / What Does It Do?
“智能趋势管家” 就像您的私人交易副驾驶。它内置了一套先进的智能平滑算法,能够自动过滤掉市场中那些骗人的假动作,只把最核心的**“市场真实韵律”通过一条平滑的波浪线展示给您。它不只是一根线,它是一套会思考的系统**。
"Smart Trend Oscillator " is like your personal trading co-pilot. It features a built-in advanced smoothing algorithm that automatically filters out deceptive market "fake-outs," revealing the "true rhythm" of the market through a single, smooth wave. It’s not just a line; it’s a thinking system.
🔥 核心功能 / Core Features
1. 🌊 智能波浪引擎 / Smart Wave Engine
不要被K线的上蹿下跳迷惑。我们的引擎能识别市场内部的真实能量。 Don't be confused by erratic candlesticks. Our engine identifies the true internal energy of the market.
过滤噪音 (Filter Noise):自动忽略短暂的随机波动。
捕捉趋势 (Capture Trends):波浪上升代表买方主导,波浪下降代表卖方主导。
2. 🛡️ 自适应波动通道 / Adaptive Channels
市场有时候像乌龟(波动小),有时候像兔子(波动大)。指标拥有一个“弹性通道”,它会根据市场活跃度自动变宽或变窄,精准判断价格是否“过热”或“超卖”。 The market moves between low and high volatility. The indicator features an "elastic channel" that automatically widens or narrows, accurately judging if the price is "Overheated" or "Oversold."
3. 🌍 全局监控面板 / Global Dashboard
右上角的面板是您的战况指挥室。一眼看懂 6 个不同时间维度的状态。全绿代表多周期共振向上,全红代表多周期共振向下。 The panel in the top-right corner is your Command Center. Understand the status of 6 different time dimensions at a glance. All Green means upward resonance; All Red means downward resonance.
⚙️ 极致的个性化定制 / Ultimate Customization
v16 版本为您提供了前所未有的控制权,让指标完全适应您的交易风格。 Version 16 gives you unprecedented control to tailor the indicator to your trading style.
🕒 1. 时间周期,由你定义 (Customizable Timeframes)
不再局限于系统默认设置。您可以在设置面板中自由输入 6 个您最关心的周期(例如:5分钟、1小时、甚至 3天)。
短线手:设置为 1分/3分/5分/15分...
波段手:设置为 1小时/4小时/日线/周线...
Benefit: You can freely input the 6 timeframes that matter most to you in the settings panel, whether you are a scalper or a swing trader.
🎯 2. 灵敏度调节 (Adjustable Sensitivity)
想要更多交易机会?还是想要更稳健的信号?
高灵敏度:调高 Zone Sensitivity,捕捉每一次微小的回调(适合激进风格)。
低灵敏度:调低数值,过滤掉小波动,只抓大趋势(适合稳健风格)。
Benefit: Dial up the sensitivity to catch every minor pullback (Aggressive), or dial it down to filter noise and catch only big trends (Conservative).
📊 3. 两种平滑模式 (SMA vs. VWMA)
您可以选择通道的计算核心:
Standard (SMA):经典模式,适合大多数市场。
Volume Weighted (VWMA):成交量加权模式。在加密货币或股票市场,它能帮您过滤掉“无量空涨”或“无量空跌”的假信号。
Benefit: Choose Standard (SMA) for general markets, or Volume Weighted (VWMA) to filter out fake moves on low volume (great for Crypto/Stocks).
🚦 信号含义 / Signals Guide
我们把复杂的逻辑浓缩成了最简单的视觉标签: We have condensed complex logic into the simplest visual labels:
🟢 绿色 BUY 标签:市场“便宜”且能量向上。 (Market is "Cheap" & Energy is Up.)
🔴 红色 SELL 标签:市场“过热”且能量向下。 (Market is "Overheated" & Energy is Down.)
🔵 蓝色 HOLD 标签:趋势延续中,建议持仓。 (Trend is continuing, suggest holding position.)
📥 快速上手 / Quick Start
加载指标 (Load):添加到您的图表。
设置周期 (Set Timeframes):在输入选项里填入您习惯查看的 6 个时间周期。
选择模式 (Choose Mode):如果是成交量重要的资产,建议开启 VWMA 模式。
等信号 (Wait):等待带方框的 BUY 或 SELL 标签出现。
把复杂留给算法,把简单留给您。 Leave the complexity to the algorithms, and keep the simplicity for yourself.
