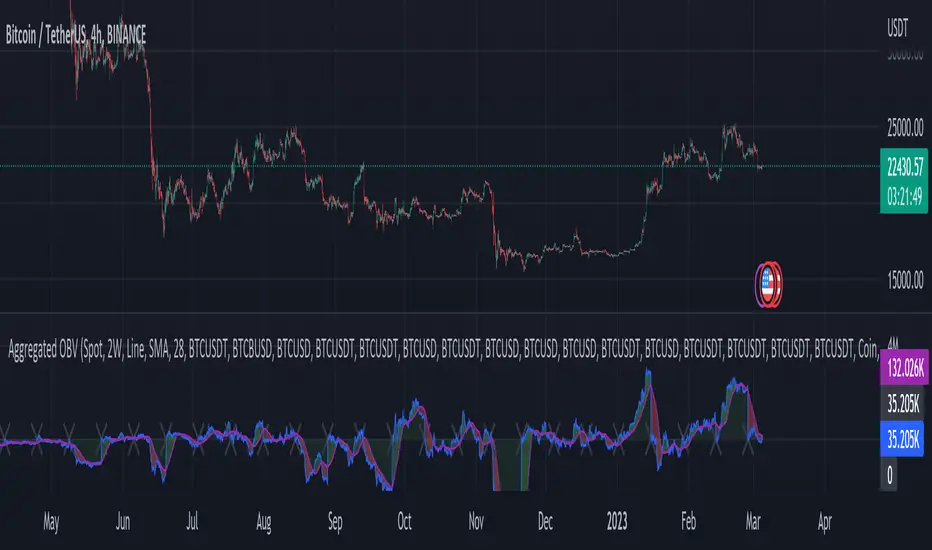
Aggregated On Balance Volume - InFinitoOn Balance Volume calculated with aggregated and normalized volume data and a few other features:
Aggregation code originally from Crypt0rus
Candle Plotting code from LonesomeTheBlue
***The indicator can be used for any coin/symbol to aggregate volume, but it has to be set up manually***
As normal OBV, this indicator can be used to find divergences and to have an idea of volume flow. Using aggregated data makes it more accurate and allows to compare volume flow between different kinds of markets (Spot, Futures, Perpetuals, Futures+Perpetuals and All Volume).
As well, in order to make the data as accurate as possible, the data from each exchange aggregated is normalized to report always in terms of 1 BTC. In case this indicator is used for another symbol, the calculations can be adjusted manually to make it always report data in terms of 1 contract/coin.
Extra features:
- Based off LonesomeTheBlue, OBV can be plotted as candles and as Heiken Aishi candles (which give wick information)
- A Moving Average (SMA, EMA, WMA, RMA, VWMA) can be plotted to the OBV. This can be used as a confluent signal to enter a trade on a crossover or to know the strength of the current move.
- The OBV basis can be reset to 0 periodically, making it more oscillator-like and allowing to focus only on a certain period of time.
Bitcoin (Crypto-monnaie)
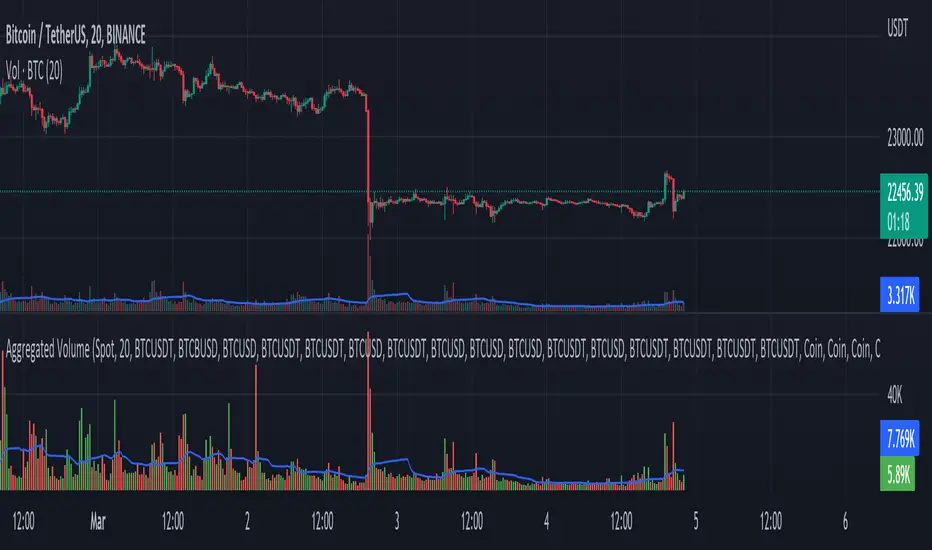
Aggregated Volume - By InFinitoVolume indicator that works like a normal Volume indicator with the following additional features:
- Aggregates Volume across different exchanges and Market Types - *Original Aggregation Code By Crypt0rus*
- Displays data by Market Type and combinations of Market Types (Spot, Futures , Perpetuals, Futures+Perpetuals & All Volume )
- Allows for the user to select the exchanges from which to aggregate Volume (This allows for the aggregation of any other pair i.e ETH, SOL, LUNA)
- Normalizes the Volume reported through TradingView by every exchange in order to homogenize the data (i.e Binance reports Bitcoin Volume in BTC terms BUT FTX reports Bitcoin Volume in USD)
- Allows for manual input of how Volume is reported in a particular Pair/Exchange (i.e If you want to aggregate data from the BTCEUR pair, you can select 'Other' and introduce the Value of EUR in USD terms)
COIN: Select this option if the volume is reported in terms of the asset traded ( BTC , ETH, SOL, etc....)
USD: Select this option if the Volume is reported in terms of the USD amount traded
OTHER: Select this option in case the Volume is reported in another currency (EUR, ETH, etc....)
NOTE: *ALL VOLUME IS AGGREGATED IN TERMS OF THE ASSET TRADED, FOR EXAMPLE IN THIS CASE: BTC . BUT IF YOU'RE AGGREGATING BNB PAIRS, VOLUME WILL BE CALCULATED TO BE DISPLAYED IN BNB TERMS*
Feel free to leave suggestions/questions in the comments or to message them directly to me
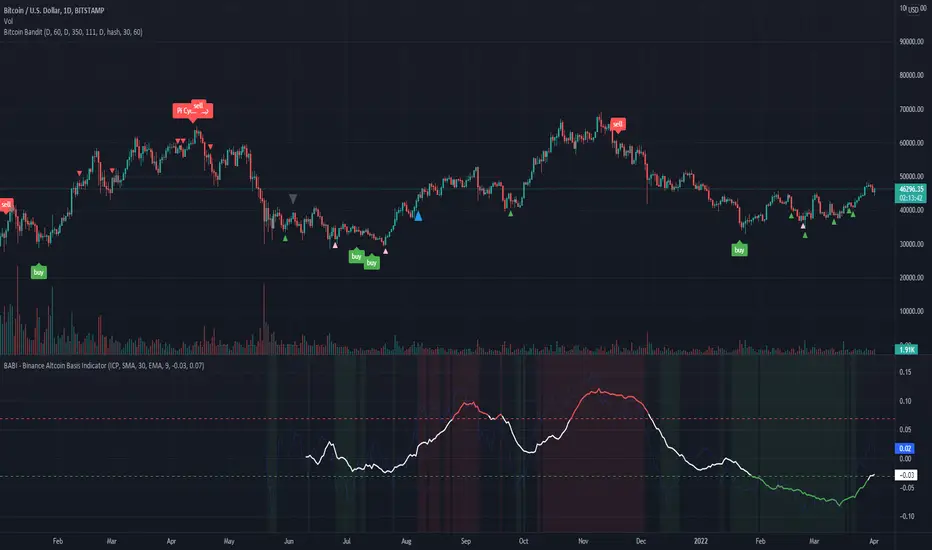
BABI - Binance Altcoin Basis Indicator
This indicator works by taking the basis between various altcoin perpetual futures contracts and spot market indexes on Binance, and then smooths out the data with a basic moving average.
The result is a useful oscillator that shows potential "buy" and "sell" areas.
Simply put, a spot premium is usually bullish and a derivatives premium is usually bearish.
Other versions of this indicator only worked for BTC and ETH, so I have extended its functionality to include popular altcoin trading pairs.
USDT Trading pairs included in this version:
•BTC
•ETH
•LTC
•ICP
•SOL
•LUNA
•GRT
•ATOM
•ADA
•XRP
•ETC
•AVAX
Default setting is BTC. To choose a different oscillator, go to settings and pick your desired crypto.
Thanks for looking. I think you could create a pretty basic trading strategy based on this indicator by simply placing buy and sell orders once the oscillator rises or falls below certain thresholds.
**Credit to @chestbrook on Twitter and Pinnacle_Investor on TradingView
Binance Basis Oscillator ()
Basic Binance Premium IndexA premium index indicator for Binance futures.
The premium index is based on the difference in price between the perpetual swap contract last price and the price of a volume weighted spot index.
Simply put: it shows you for each coin whether the spot market is trading higher than the Binance perpetual or not.
If future price is higher than spot in a rally, the rally isn't backed by real buys (spot) but by dumb perpetual longs which can indicate bearish PA. If spot price is higher than futures in a rally, the upside is backed by real money (spot) which can indicate bullish PA.
To calculate the premium, I simply took (futures_price/vwap(spot_price)-1)*100
This version includes
•BTC
•ETH
•LTC
•ICP
•BNB
•ADA
•DOGE.
You can display data as a smoothed moving average for improved readability.
This code is open source so feel free to use it in your scripts.

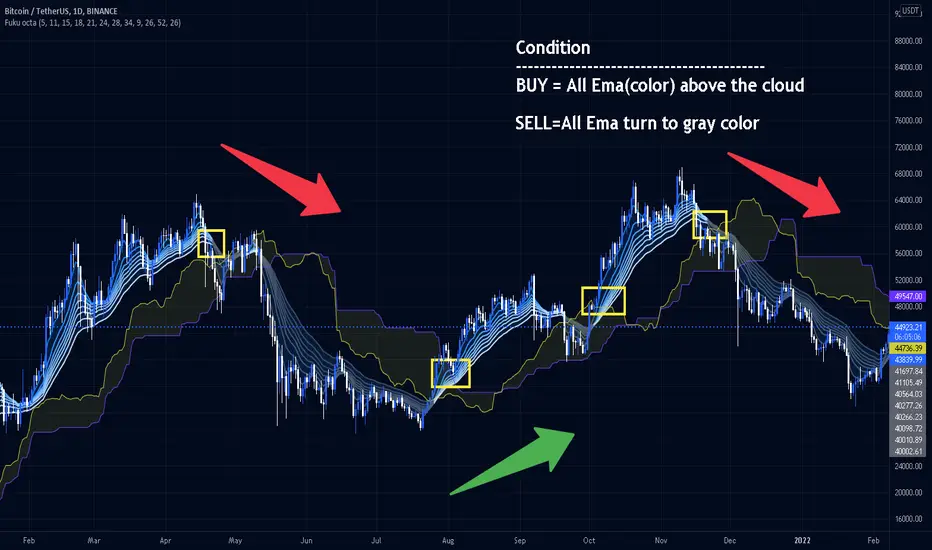
Fukuiz Octa-EMA + IchimokuThis indicator base on EMA of 8 different period and Ichimoku Cloud.
#A brief introduction to Ichimoku #
The Ichimoku Cloud is a collection of technical indicators that show support and resistance levels, as well as momentum and trend direction. It does this by taking multiple averages and plotting them on a chart. It also uses these figures to compute a “cloud” that attempts to forecast where the price may find support or resistance in the future.
#A brief introduction to EMA#
An exponential moving average (EMA) is a type of moving average (MA) that places a greater weight and significance on the most recent data points. The exponential moving average is also referred to as the exponentially weighted moving average. An exponentially weighted moving average reacts more significantly to recent price changes than a simple moving average (SMA), which applies an equal weight to all observations in the period.
I combine this together to help you reduce the false signals in Ichimoku.
#How to use#
EMA (Color) = Bullish trend
EMA (Gray) = Bearish trend
#Buy condition#
Buy = All Ema(color) above the cloud.
#Sell condition#
SELL= All Ema turn to gray color.
Bitcoin Best Value CorridorHere is my interpretation of the "Best Time To Buy" Bitcoin over its lifetime using a logarithmic regression trendline. The upper and lower lines are 10% deviations from the centre line. I calculated the trendline in excel and then coded my results into pine script.

Lev Umanov Sin EquationThis indicator is taken from the calculations made by Lev Umanov. It predicts the peaks of Bitcoin. The indicator works with most BTCUSD pairings.

Momentum CloudThis is a modified Ichimoku Cloud:
-The default Lookback-Length and Displacement settings have been modified to operate optimally on 24/7 markets - which is popular among Crypto analysts.
-The Lagging Span, Base Line, and Conversion Line have been removed - leaving just the bare cloud.
-Additionally, the Cloud's color will shift blue when it is compressed. (More specifically - when Leading Span A retreats to Leading Span B, the color changes.)
This allows the user to easily identify when the Cloud is "thinning", either to the upside, or the downside.
Being that the "spread" or "width" of an Ichimoku Cloud generally gauges it's efficacy as potential Support or Resistance, this tool is particularly useful for highlighting when momentum is weakening.
*This script will be updated in the future to allow the user to view the Momentum Cloud of alternate time-frames! (e.g, Viewing the 1D Momentum Cloud on the 1H timeframe)

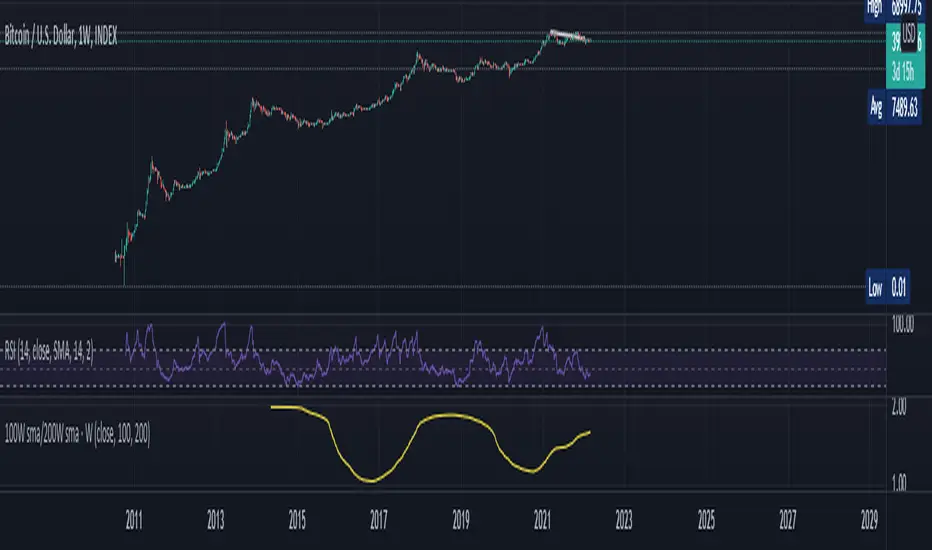
100W sma/200W smaThis is an Indicator specifically made for BTC/USD ( Index)
Zoom out on Daily and Weekly candles as much and you can SEE a trend . A very very important trend and you shall remember this indicator with Years to come . This is a VERY long term type indicator and can help you with long term hodling investor mindset analysis .
Bitcoin Power Law Bands (BTC Power Law) Indicator█ OVERVIEW
The 'Bitcoin Power Law Bands' indicator is a set of three US dollar price trendlines and two price bands for bitcoin , indicating overall long-term trend, support and resistance levels as well as oversold and overbought conditions. The magnitude and growth of the middle (Center) line is determined by double logarithmic (log-log) regression on the entire USD price history of bitcoin . The upper (Resistance) and lower (Support) lines follow the same trajectory but multiplied by respective (fixed) factors. These two lines indicate levels where the price of bitcoin is expected to meet strong long-term resistance or receive strong long-term support. The two bands between the three lines are price levels where bitcoin may be considered overbought or oversold.
All parameters and visuals may be customized by the user as needed.
█ CONCEPTS
Long-term models
Long-term price models have many challenges, the most significant of which is getting the growth curve right overall. No one can predict how a certain market, asset class, or financial instrument will unfold over several decades. In the case of bitcoin , price history is very limited and extremely volatile, and this further complicates the situation. Fortunately for us, a few smart people already had some bright ideas that seem to have stood the test of time.
Power law
The so-called power law is the only long-term bitcoin price model that has a chance of survival for the years ahead. The idea behind the power law is very simple: over time, the rapid (exponential) initial growth cannot possibly be sustained (see The seduction of the exponential curve for a fun take on this). Year-on-year returns, therefore, must decrease over time, which leads us to the concept of diminishing returns and the power law. In this context, the power law translates to linear growth on a chart with both its axes scaled logarithmically. This is called the log-log chart (as opposed to the semilog chart you see above, on which only one of the axes - price - is logarithmic).
Log-log regression
When both price and time are scaled logarithmically, the power law leads to a linear relationship between them. This in turn allows us to apply linear regression techniques, which will find the best-fitting straight line to the data points in question. The result of performing this log-log regression (i.e. linear regression on a log-log scaled dataset) is two parameters: slope (m) and intercept (b). These parameters fully describe the relationship between price and time as follows: log(P) = m * log(T) + b, where P is price and T is time. Price is measured in US dollars , and Time is counted as the number of days elapsed since bitcoin 's genesis block.
DPC model
The final piece of our puzzle is the Dynamic Power Cycle (DPC) price model of bitcoin . DPC is a long-term cyclic model that uses the power law as its foundation, to which a periodic component stemming from the block subsidy halving cycle is applied dynamically. The regression parameters of this model are re-calculated daily to ensure longevity. For the 'Bitcoin Power Law Bands' indicator, the slope and intercept parameters were calculated on publication date (March 6, 2022). The slope of the Resistance Line is the same as that of the Center Line; its intercept was determined by fitting the line onto the Nov 2021 cycle peak. The slope of the Support Line is the same as that of the Center Line; its intercept was determined by fitting the line onto the Dec 2018 trough of the previous cycle. Please see the Limitations section below on the implications of a static model.
█ FEATURES
Inputs
• Parameters
• Center Intercept (b) and Slope (m): These log-log regression parameters control the behavior of the grey line in the middle
• Resistance Intercept (b) and Slope (m): These log-log regression parameters control the behavior of the red line at the top
• Support Intercept (b) and Slope (m): These log-log regression parameters control the behavior of the green line at the bottom
• Controls
• Plot Line Fill: N/A
• Plot Opportunity Label: Controls the display of current price level relative to the Center, Resistance and Support Lines
Style
• Visuals
• Center: Control, color, opacity, thickness, price line control and line style of the Center Line
• Resistance: Control, color, opacity, thickness, price line control and line style of the Resistance Line
• Support: Control, color, opacity, thickness, price line control and line style of the Support Line
• Plots Background: Control, color and opacity of the Upper Band
• Plots Background: Control, color and opacity of the Lower Band
• Labels: N/A
• Output
• Labels on price scale: Controls the display of current Center, Resistance and Support Line values on the price scale
• Values in status line: Controls the display of current Center, Resistance and Support Line values in the indicator's status line
█ HOW TO USE
The indicator includes three price lines:
• The grey Center Line in the middle shows the overall long-term bitcoin USD price trend
• The red Resistance Line at the top is an indication of where the bitcoin USD price is expected to meet strong long-term resistance
• The green Support Line at the bottom is an indication of where the bitcoin USD price is expected to receive strong long-term support
These lines envelope two price bands:
• The red Upper Band between the Center and Resistance Lines is an area where bitcoin is considered overbought (i.e. too expensive)
• The green Lower Band between the Support and Center Lines is an area where bitcoin is considered oversold (i.e. too cheap)
The power law model assumes that the price of bitcoin will fluctuate around the Center Line, by meeting resistance at the Resistance Line and finding support at the Support Line. When the current price is well below the Center Line (i.e. well into the green Lower Band), bitcoin is considered too cheap (oversold). When the current price is well above the Center Line (i.e. well into the red Upper Band), bitcoin is considered too expensive (overbought). This idea alone is not sufficient for profitable trading, but, when combined with other factors, it could guide the user's decision-making process in the right direction.
█ LIMITATIONS
The indicator is based on a static model, and for this reason it will gradually lose its usefulness. The Center Line is the most durable of the three lines since the long-term growth trend of bitcoin seems to deviate little from the power law. However, how far price extends above and below this line will change with every halving cycle (as can be seen for past cycles). Periodic updates will be needed to keep the indicator relevant. The user is invited to adjust the slope and intercept parameters manually between two updates of the indicator.
█ RAMBLINGS
The 'Bitcoin Power Law Bands' indicator is a useful tool for users wishing to place bitcoin in a macro context. As described above, the price level relative to the three lines is a rough indication of whether bitcoin is over- or undervalued. Users wishing to gain more insight into bitcoin price trends may follow the author's periodic updates of the DPC model (contact information below).
█ NOTES
The author regularly posts on Twitter using the @DeFi_initiate handle.
█ THANKS
Many thanks to the following individuals, who - one way or another - made the 'Bitcoin Power Law Bands' indicator possible:
• TradingView user 'capriole_charles', whose open-source 'Bitcoin Power Law Corridor' script was the basis for this indicator
• Harold Christopher Burger, whose Bitcoin’s natural long-term power-law corridor of growth article (2019) was the basis for the 'Bitcoin Power Law Corridor' script
• Bitcoin Forum user "Trololo", who posted the original power law model at Logarithmic (non-linear) regression - Bitcoin estimated value (2014)

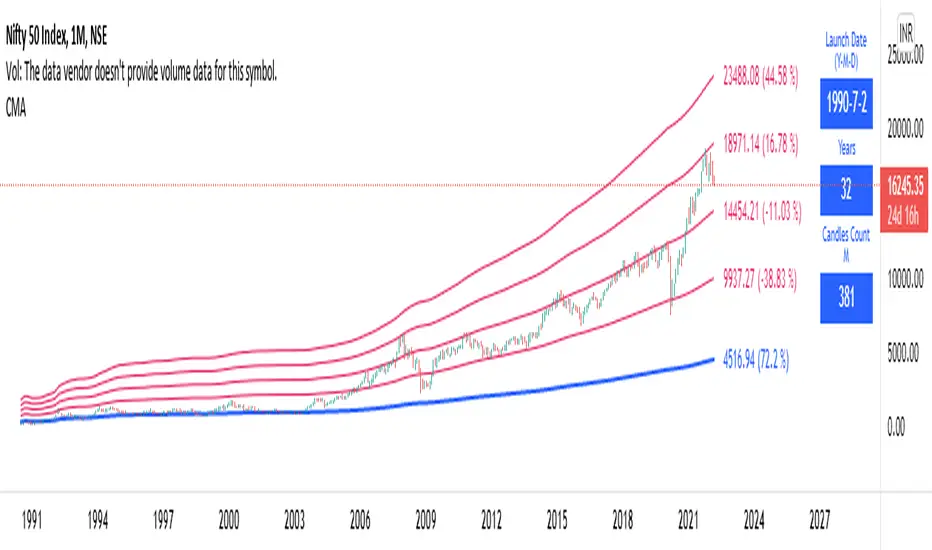
Long Term: Cumulative Moving AverageWho to use?
This indicator is for Long Term Investors or for Position trading and not for Day traders.
What time-frame to use?
• Daily, Weekly or Monthly
What is Blue line?
• Blue line is Cumulative Moving Average. It is cumulative sum of closing price.
• It is a trend reversal level.
• It is a strong support level.
• If price is below Blue line better not to take any Long position until it crosses above it.
What are Red lines?
• Red lines are Multiplier levels.
• These are target levels to exit the position.
• It can be breakout or pull back levels.
• The level combination numbers can be fully odd or even numbers.
• For example in certain stocks the working levels will be 1x, 3x, 5x etc., in others it will be even numbers like 2x, 4x, 6x etc.
• In some cases the levels need to be tweaked with custom decimals like 1.1x, 2.1x, 3.1x, 4.1x etc. to align the support & resistance levels.
How to use?
Entry
• Enter when the Price reach closer to the Blue line.
• Enter Long when the Price takes a pullback or breakout at the Red lines.
Exit
• Exit position when the Price reach closer to the Red lines in Long positions.
Indicator Menu
• Works only in higher time-frames like D, W & M.
• Will not work in Lower time-frames less than "D" or the Launch Date shows wrong in Lower time-frames.
Multipliers:
(Read above What are Red lines?)
Launch Date:
• Launch Date: Starting date of stock when it appeared in the exchange. Works only in D, W & M timeframes.
• Years: Total number of years from the Launch Date. Accurate date will be shown in Daily timeframe.
• Candles Count: Total number of candles from the Launch Date in the current timeframe.
Labels:
• First number is last traded price.
• Second number in () is percentage change from last traded price to that level.
Follow the Crypto ShortsThis script allows to test the impact of variations in the number of BTCUSD Shorts Positions on its price. In particular, it compares the number of short positions with its moving average to decide if shorts are being liquidated. In case the number of short positions crosses below its moving average, it will generate a Long Position, which will be closed if shorts crosses above its moving average.

Mayer Multiple StrategyCreated by Trace Mayer, the Mayer Multiple is calculated dividing the current price of Bitcoin by its 200-day moving average. This simple script allows to backtest strategies based on Mayer Multiple levels, which can be easily adjusted. It can be tested on any chart and any timeframe.

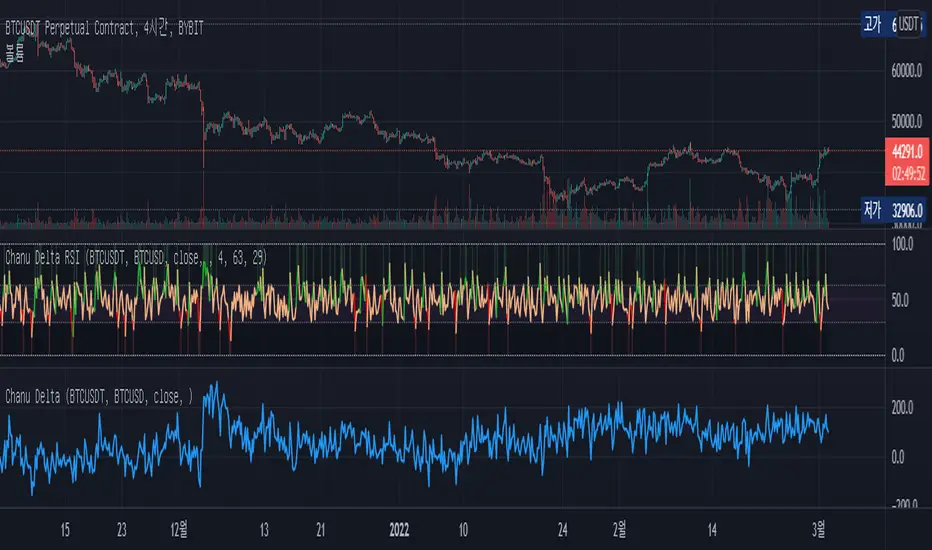
Chanu Delta RSIThis Chanu Delta RSI indicates the strength of the Bitcoin market. The problem with the previous Chanu Delta Indicator was that it was simply based on the price difference between the two Bitcoin markets, so there was no universality. However, this new Chanu Delta RSI solves the problem by introducing an RSI that compares the price difference trend.
This indicator is selectable from both reference and large amplitude BTCUSD markets. I recommend using BYBIT:BTCUSDT for the reference market and COINBASE:BTCUSD for the large amplitude market.
_____________________________________________________________
이 지표는 비트코인 시장의 단기적인 추세를 판단하는데 도움을 줄 수 있습니다. 기존 Chanu Delta 지표의 문제점은 단순히 두 비트코인 시장의 가격차를 기준으로 하여 보편성이 없었다는 점이다. 하지만 이번 새로운 Chanu Delta RSI는 가격차이 추세를 비교하는 RSI를 도입해 문제를 해결했습니다.
이 지표는 레퍼런스 및 큰 진폭 BTCUSD 시장에서 모두 선택할 수 있습니다. 레퍼런스 시장에는 BYBIT:BTCUSDT를 사용하고 큰 진폭 시장에는 COINBASE:BTCUSD를 사용하는 것이 좋습니다.
Chanu Delta RSI StrategyThis strategy is built on the Chanu Delta RSI , which indicates the strength of the Bitcoin market. The problem with the previous Chanu Delta Strategy was that it was simply based on the price difference between the two Bitcoin markets, so there was no universality. However, this new Chanu Delta RSI strategy solves the problem by introducing an RSI that compares the price difference trend.
When the Chanu Delta RSI hits “Bull Level” and “Bear Level” and closes the candle, long and short signals are triggered respectively. The example shown on the screen is a default setting optimized for a 4-hour candlestick strategy based on the Bybit BTCUSDT futures market. You can use it by adjusting the setting value and modifying it to suit you.
This strategy is selectable from both reference and large amplitude BTCUSD markets in order to enable fine backtesting. I recommend using BYBIT:BTCUSDT for the reference market and COINBASE:BTCUSD for the large amplitude market.
(Note) Using the "Chanu Delta RSI" to know the current indicator value in real time, it is convenient to predict the signal of the strategy.
(Note) Because the Chanu Delta RSI represents the price difference based on the Bybit BTCUSDT futures market, backtesting is possible from March 2020.
_____________________________________________________________
이 전략은 비트코인 시장의 강점을 나타내는 Chanu Delta RSI를 기반으로 합니다. 기존 Chanu Delta 전략의 문제점은 단순히 두 비트코인 시장의 가격차를 기준으로 하여 보편성이 없었다는 점이다. 하지만 이번 새로운 Chanu Delta RSI 전략은 가격차이 추세를 비교하는 RSI를 도입해 문제를 해결했습니다.
Chanu Delta RSI가 "Bull Level"과 "Bear Level"에 도달하고 봉마감하면 롱, 숏 신호가 각각 트리거됩니다. 화면에 보이는 예시는 Bybit BTCUSDT 선물 시장을 기반으로 한 4시간 캔들스틱 전략에 최적화된 기본 설정입니다. 설정값을 조정하여 자신에게 맞게 수정하여 사용하시면 됩니다.
이 전략은 정밀한 백테스팅을 가능하게 하기 위해 참조 및 큰 진폭 BTCUSD 시장에서 모두 선택할 수 있습니다. 참조 시장에는 BYBIT:BTCUSDT를 사용하고 큰 진폭 시장에는 COINBASE:BTCUSD를 사용하는 것이 좋습니다.
(주) "Chanu Delta RSI"를 이용하여 현재 지표 값을 실시간으로 알 수 있어 전략의 시그널을 예측하는데 편리합니다.
(주) Chanu Delta RSI는 바이비트 BTCUSDT 선물시장을 기준으로 가격차이를 나타내므로 2020년 3월부터 백테스팅이 가능합니다.

MovingAveragesLibraryLibrary "MovingAveragesLibrary"
This is a library allowing one to select between many different Moving Average formulas to smooth out any float variable.
You can use this library to apply a Moving Average function to any series of data as long as your source is a float.
The default application would be for applying Moving Averages onto your chart. However, the scope of this library is beyond that. Any indicator or strategy you are building can benefit from this library.
You can apply different types of smoothing and moving average functions to your indicators, momentum oscillators, average true range calculations, support and resistance zones, envelope bands, channels, and anything you can think of to attempt to smooth out noise while finding a delicate balance against lag.
If you are developing an indicator, you can use the 'ave_func' to allow your users to select any Moving Average for any function or variable by creating an input string with the following structure:
var_name = input.string(, , )
Where the types of Moving Average you would like to be provided would be included in options.
Example:
i_ma_type = input.string(title = "Moving Average Type", defval = "Hull Moving Average", options = )
Where you would add after options the strings I have included for you at the top of the PineScript for your convenience.
Then for the output you desire, simply call 'ave_func' like so:
ma = ave_func(source, length, i_ma_type)
Now the plotted Moving Average will be the same as what you or your users select from the Input.
ema(src, len) Exponential Moving Average.
Parameters:
src : Series to use ('close' is used if no argument is supplied).
len : Lookback length to use.
Returns: Float value.
sma(src, len) Simple Moving Average.
Parameters:
src : Series to use ('close' is used if no argument is supplied).
len : Lookback length to use.
Returns: Float value.
rma(src, len) Relative Moving Average.
Parameters:
src : Series to use ('close' is used if no argument is supplied).
len : Lookback length to use.
Returns: Float value.
wma(src, len) Weighted Moving Average.
Parameters:
src : Series to use ('close' is used if no argument is supplied).
len : Lookback length to use.
Returns: Float value.
dv2(len) Donchian V2 function.
Parameters:
len : Lookback length to use.
Returns: Open + Close / 2 for the selected length.
ModFilt(src, len) Modular Filter smoothing function.
Parameters:
src : Series to use ('close' is used if no argument is supplied).
len : Lookback length to use.
Returns: Float value.
EDSMA(src, len) Ehlers Dynamic Smoothed Moving Average.
Parameters:
src : Series to use ('close' is used if no argument is supplied).
len : Lookback length to use.
Returns: EDSMA smoothing.
dema(x, t) Double Exponential Moving Average.
Parameters:
x : Series to use ('close' is used if no argument is supplied).
t : Lookback length to use.
Returns: DEMA smoothing.
tema(src, len) Triple Exponential Moving Average.
Parameters:
src : Series to use ('close' is used if no argument is supplied).
len : Lookback length to use.
Returns: TEMA smoothing.
smma(x, t) Smoothed Moving Average.
Parameters:
x : Series to use ('close' is used if no argument is supplied).
t : Lookback length to use.
Returns: SMMA smoothing.
vwma(x, t) Volume Weighted Moving Average.
Parameters:
x : Series to use ('close' is used if no argument is supplied).
t : Lookback length to use.
Returns: VWMA smoothing.
hullma(x, t) Hull Moving Average.
Parameters:
x : Series to use ('close' is used if no argument is supplied).
t : Lookback length to use.
Returns: Hull smoothing.
covwma(x, t) Coefficient of Variation Weighted Moving Average.
Parameters:
x : Series to use ('close' is used if no argument is supplied).
t : Lookback length to use.
Returns: COVWMA smoothing.
frama(x, t) Fractal Reactive Moving Average.
Parameters:
x : Series to use ('close' is used if no argument is supplied).
t : Lookback length to use.
Returns: FRAMA smoothing.
kama(x, t) Kaufman's Adaptive Moving Average.
Parameters:
x : Series to use ('close' is used if no argument is supplied).
t : Lookback length to use.
Returns: KAMA smoothing.
donchian(len) Donchian Calculation.
Parameters:
len : Lookback length to use.
Returns: Average of the highest price and the lowest price for the specified look-back period.
tma(src, len) Triangular Moving Average.
Parameters:
src : Series to use ('close' is used if no argument is supplied).
len : Lookback length to use.
Returns: TMA smoothing.
VAMA(src, len) Volatility Adjusted Moving Average.
Parameters:
src : Series to use ('close' is used if no argument is supplied).
len : Lookback length to use.
Returns: VAMA smoothing.
Jurik(src, len) Jurik Moving Average.
Parameters:
src : Series to use ('close' is used if no argument is supplied).
len : Lookback length to use.
Returns: JMA smoothing.
MCG(src, len) McGinley smoothing.
Parameters:
src : Series to use ('close' is used if no argument is supplied).
len : Lookback length to use.
Returns: McGinley smoothing.
zlema(series, length) Zero Lag Exponential Moving Average.
Parameters:
series : Series to use ('close' is used if no argument is supplied).
length : Lookback length to use.
Returns: ZLEMA smoothing.
xema(src, len) Optimized Exponential Moving Average.
Parameters:
src : Series to use ('close' is used if no argument is supplied).
len : Lookback length to use.
Returns: XEMA smoothing.
EhlersSuperSmoother(src, lower) Ehlers Super Smoother.
Parameters:
src : Series to use ('close' is used if no argument is supplied).
lower : Smoothing value to use.
Returns: Ehlers Super smoothing.
EhlersEmaSmoother(sig, smoothK, smoothP) Ehlers EMA Smoother.
Parameters:
sig : Series to use ('close' is used if no argument is supplied).
smoothK : Lookback length to use.
smoothP : Smothing value to use.
Returns: Ehlers EMA smoothing.
ave_func(in_src, in_len, in_type) Returns the source after running it through a Moving Average function.
Parameters:
in_src : Series to use ('close' is used if no argument is supplied).
in_len : Lookback period to be used for the Moving Average function.
in_type : Type of Moving Average function to use. Must have a string input to select the options from that MUST match the type-casing in the function below.
Returns: The source as a float after running it through the Moving Average function.

BTC Gravity OscillatorThis indicator is a deviation of a Center of Gravity Oscillator corrected for the diminishing returns of Bitcoin.
I've set up this indicator for it to be used on the weekly timeframe. The indicator oscillates between 0 and 10, where 0 indicates oversold conditions and 10 indicates overbought conditions.
The indicator plots in any BTCUSD spot, futures , BLX index and BTCEUR .
It paints in all time frames, but Weekly time frame is the correct one to interpret the 'official' read of it.

AnyChartI changed few lines of code from TradingView's original Open Interest indicator to make this one. I wanted to compare other charts to while entering my trade like looking at BTC when trading in alts. It has option to view any chart. Add other things to improve your analysis.

Combo Ichimoku + CDC Action Zone by fukuizThis indicator combines the famous indicators Ichimoku and CDC ActionZone.
#A brief introduction to Ichimoku #
The Ichimoku Cloud is a collection of technical indicators that show support and resistance levels, as well as momentum and trend direction. It does this by taking multiple averages and plotting them on a chart. It also uses these figures to compute a “cloud” that attempts to forecast where the price may find support or resistance in the future.
#A brief introduction to CDC ActionZone #
CDC ActionZone is a very simple system, utilizing just two exponential moving averages. The 'zones' in which different 'actions' should be taken are highlighted in different colors. Calculations for the zones
They are based on the relative position of price to the two EMA lines and the relationship between the two EMAs.
The CDC ActionZone was developed by Piriya333, a Thai technical analyst.
#How to use #
The basic method for using Ichimoku+CDC ActionZone is to follow the green/red color and the cloud.
Buy condition
-Buy when the bar closes in green and closes above the cloud
Sell condition
-sell when the bar closes in red.

Cowen CorridorI'm reposting the Cowen Corridor that was originally developed by Benjamin Cowen of "Into the Cryptoverse"
This indicator was originally developed by Ben publicly on stream. It may be used to predict upper and lower bound limits for the price of Bitcoin .
I've set up this indicator for it to be used on the weekly timeframe as was intended.
The indicator plots in any BTCUSD spot, futures , BLX index and BTCEUR .
It paints in all time frames, but Weekly time frame is the correct one to interpret the 'official' read of it.
For that reason, I've enabled by default an option that forces the indicator to display on the Weekly value even though the time frame could be higher or lower.
Credit for this idea goes to Benjamin Cowen: @intocryptoverse

CDOI ProfileCumulative Delta of Open Interest Profile
This script lets you visualize where there were Open Interest build-ups and discharges on a price basis.
It only supports pairs where TradingView added the appropriate Open Interest data (at the time of posting that is only Binance and Kraken perpetual contracts)
The script uses my own functions to poll lower timeframe data and compile it into a higher timeframe profile. And as such, it needs some tweaking to adjust it to your timeframe until Tradingview lets me do it codewise (hopefully one day)
The instructions for using the Indicators are as follows:
Condition: How often a new profile should be generated
Sampling Rate and 1/Nth of the TF: These have to be calculated together to have a product that should correspond to the current timeframe in minutes. A few examples below
----------- Sampling - 1Nth of the TF
5 min ------- 5 --------------- 1
10 min ------ 10 ------------- 1
15 min ------ 5 --------------- 3
20 min ------ 10 ------------- 2
30 min ------ 10 -------------- 3
45 min ------- 9 -------------- 5
1 hour ------- 10 ------------- 6
4 hours ----- 10 -------------- 24
1 day -------- 10 ------------- 144
Transparency: This one is pretty self-explanatory but only applies to the Profile bars
% change for a bar: This one indicates how precise each bar will be, but if you go too low the script becomes too heavy and stop running
Bar limit: Limits the amounts of bars the script is run for (ae for the last 1000 bars). Lower = faster loading, too high will stop running
UI color: Color and transparency of the center line and the box surrounding the whole profile

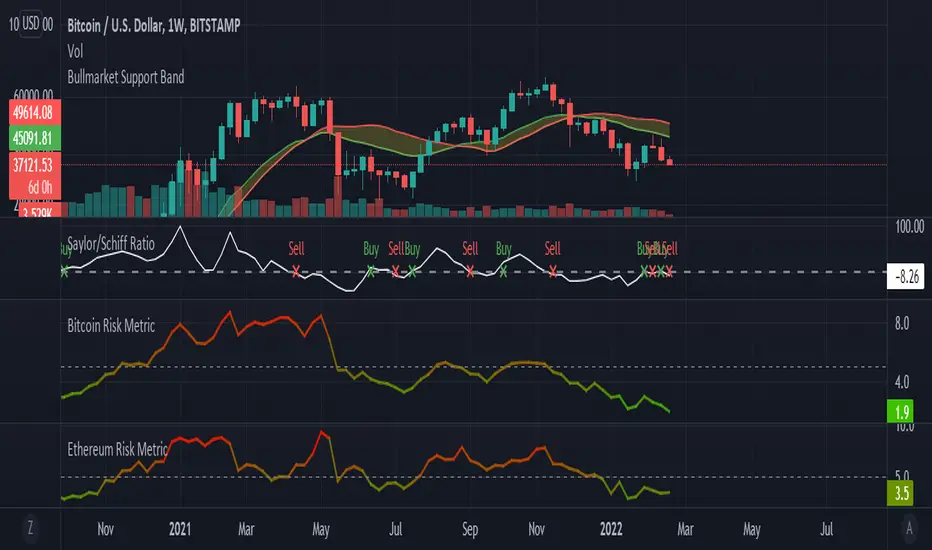
Saylor to Schiff RatioI'm reposting the Saylor to Schiff Ratio indicator that was originally developed by Michael Silva
This indicator may be used to predict key momentum shifts in the price of Bitcoin
I've set up this indicator for it to be used on the weekly timeframe as was intended.
The indicator plots in any BTCUSD spot, futures , BLX index and BTCEUR .
It paints in all time frames, but Weekly time frame is the correct one to interpret the 'official' read of it.
For that reason, I've enabled by default an option that forces the indicator to display on the Weekly value even though the time frame could be higher or lower.
Credit for this idea goes to Michael Silva: @mikepsilva
BTC Cap Dominance RSIBTC Cap Dominance RSI indicator is a combination of the RSI of Bitcoin Market Cap and the RSI of Bitcoin Dominance. The concept of this indicator is to get a good grasp of the bitcoin market flow by combining bitcoin dominance as well as bitcoin market cap.
BTC Cap Dominance (BCD) RSI is defined as:
BCD RSI = (BTC Cap RSI + BTC Dominance RSI) / 2
Case 1 (Bull market):
Both Cap RSI and Dominance RSI values are high
Case 2 (Neutral market):
Cap RSI is high but Dominance RSI is low
Cap RSI is low but Dominance RSI is high
Case 3 (Bear market):
Both Cap RSI and Dominance RSI values are low
(Note) Please note that the market capitalization symbols (CRYPTOCAP:TOTAL and CRYPTOCAP:TOTAL2) of TradingView started in January 2020, so you can check the indicator value from this point on.
