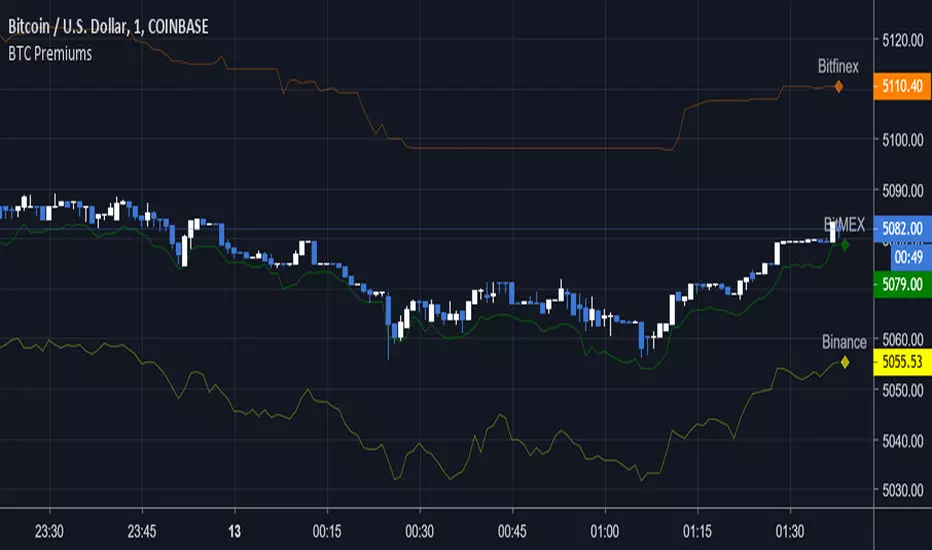
BTC Multi-Premiums — SharkCIAShows the price of BTC on multiple exchanges, helps to see which is leading in price and if the current price is above or below average.
For use on COINBASE:BTCUSD unless you customize it
To use on other platforms (Bitfinex, BitMEX, etc) go to options and enable "Show Coinbase" then hide whatever exchange you're currently on.
To disable exchanges, uncheck them under the Styles tab.
Bitcoin (Crypto-monnaie)
Ichimoku OverlaysHello!
Here is a script I wrote awhile ago. Basically the Ichmoku Overlays script takes the Ichimoku Cloud indicator and adds 4 timeframes to it.
Timeframes include multiples of 1, 3, 5, 10, 15. So basically if your interval timeframe is set to 1D you will see 1D, 3D, 5D, 10D, and 15D clouds. If you TF is set to 1m you will see 1m, 3m, 5m, 10m, 15m, etc.
The specific timeframe visibility can be set on/off in settings.
The purpose of this script is to show support/resistance zones in areas you might not see if you don't have the correct timeframe on.
Please feel free to PM me if you have any questions or suggestions!
Tips are welcome and can be sent to:
- BTC : 34dGv2EAxJ7HVpoAZHXg8RDKaX7KGCVUUW
- EOS : jwlondon1234
Enjoy!

NVT Signal with RMA and thresholds [alertable]NVT Signal, or NVTS, is an indicator that compares the market cap of Bitcoin to the aggregate USD value of daily transactions on the Bitcoin blockchain. It is a value indicator that shows a multiple of Bitcoin price against the actual usage of its blockchain. When the NVTS is low, it suggests Bitcoin price is low relative to the amount of utility the network provides, and vice versa.
For more information on NVTS, visit medium.com
This indicator aims to provide the following:
1. An open-source implementation of NVTS on Tradingview, as the most popular one currently is closed-source.
2. To provide two simple ways to define and visualize "overbought" or "oversold" conditions using the NVTS. Here, we have absolute value of NVTS & deviation from a long-term moving average.
3. Crude integration into Tradingview's alert system.
What this indicator CANNOT do:
1. Timeframes below 1d.
2. Signals based on statistical analyses, such as seen in Bollinger Bands et al. (However, with the appropriate type of account, you can add BBands on top of this indicator.)
I would like to express my gratitude to Willy Woo, Chris Burniske and Dimitry Kalichkin for their work on NVT Ratio and NVT Signal, without which my indicator would not have been created.
Feel free to fork & improve, or experiment with settings. I hope this indicator will be useful to someone.
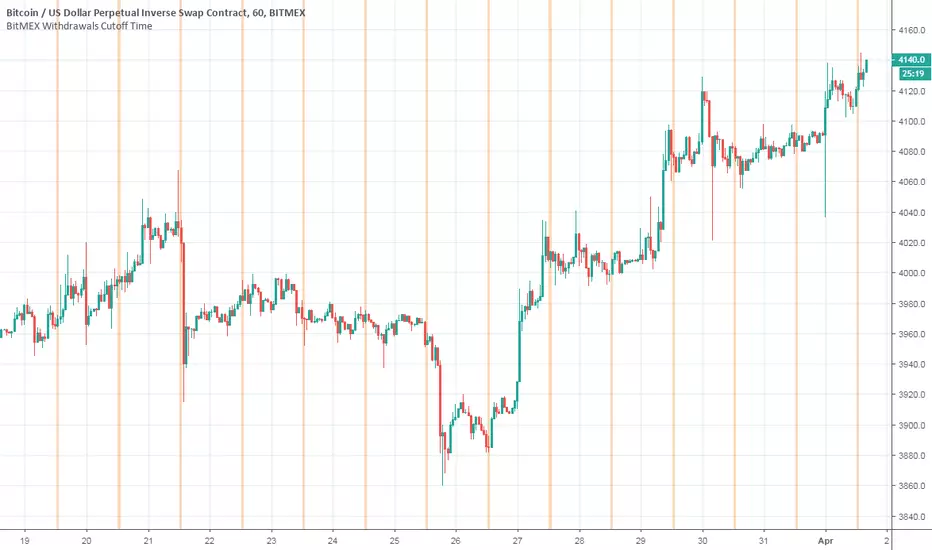
BitMEX Withdrawals Cutoff TimeThis indicator highlights time on the chart when BitMEX processes withdrawals.
Pivot Point Daily prediction bitcoin - by Simon-RoseThis is an additional Script to my recent Pivot Point indicator scripts which will show you the next days pivot points based on the actual price range.
This is useful if you are trading right before a new day and want to know how the next bdays pivot points may be placed.
If you have any questions or suggestions pls write me :)
Happy trading
Cheers
Daily Pivots:
Weekly Version:
Monthly Version:

Delta longs-shorts. BITFINEX:BTCUSDFor any timeframe. Use for the BTC/USD pair. It is calculated by the formula: longs - shorts. Used data from Bitfinex. To smooth the values, you can use the EMA embedded in the indicator.

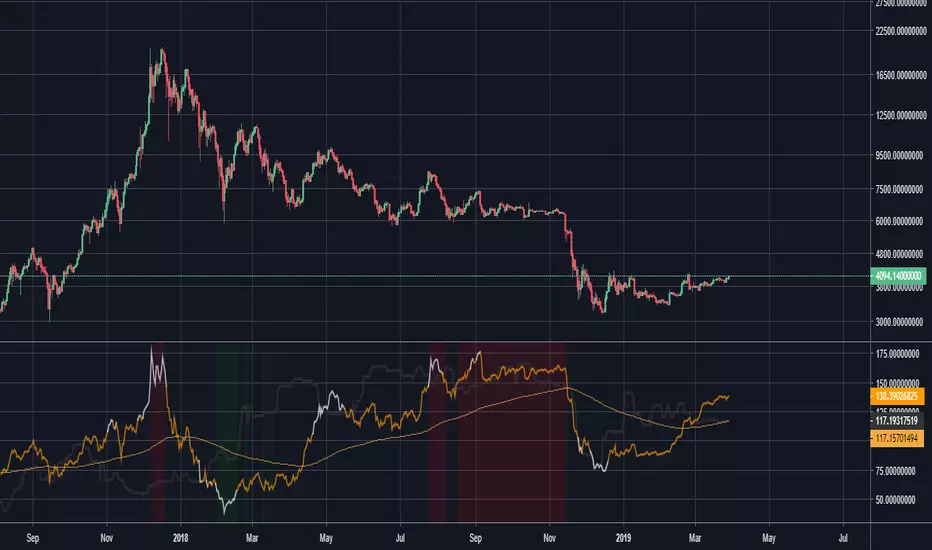
BTC exchange trade vol / on-chain transaction volThis Bitcoin indicator shows the percentage that the exchange traded volume is from the sum of the exchange traded volume + on-chain transaction volume.
The thin red line is the non-smoothed value calculated from daily volumes.
The thick black line is the 7-day EMA-smoothed value.
The exchange traded volume and the on-chain transaction volume are reported by Quandl and have a 1D resolution - so it is best to use this indicator on the daily time frame.
When the value is high, it shows the the interest of traders is high and they are intensely trading BTC. When the indicator is low, it means that BTC is "dormant": it is used for transfers, but not so much for trading - traders forgot about it for a while - which may be a good time to accumulate if the economy is in a general bull market.

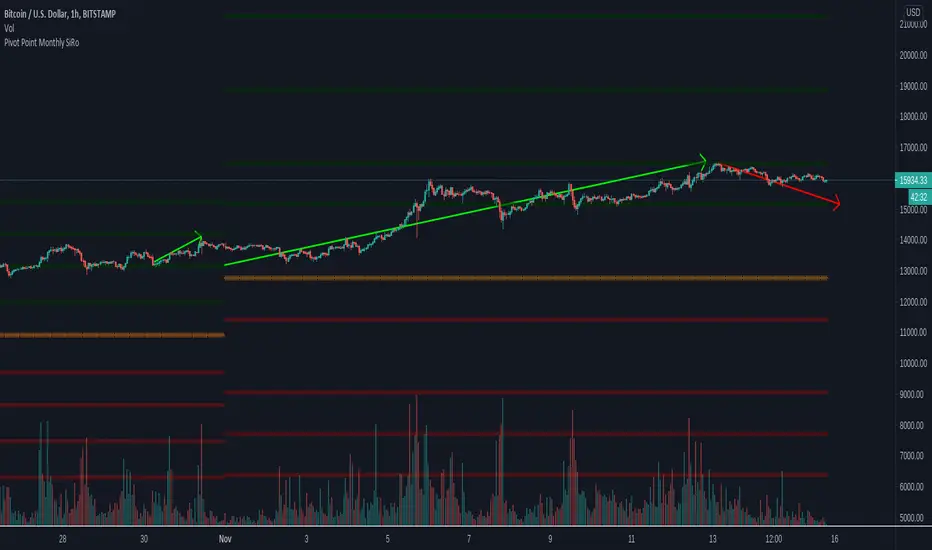
Pivot Point Monthly - bitcoin by Simon-RoseMonthly Version:
I have written 3 Indicators because i couldn't find what i was looking for in the library, so you can turn each one on and off individually for better visibility.
This are Daily, Weekly and Monthly Pivot Points with their Resistance and Support Points
and also on the Daily with the range between them.
I will also publish some Ideas to show you how to use them if you are not familiar with the traditional pivot points strategy already.
Unlike the usually 3 support & resistances i added 4 of them, specifically for trading bitcoin (on traditional markets this level of volatility usually never gets touched)
Here you can see which lines are what for reference, as the Feature to label lines is missing in Pinescript (if you have a workaround pls tell me ;) )
This is the basic calculation used :
PP = (xHigh+xLow+xClose) / 3
R1 = vPP+(vPP-Low)
R2 = vPP + (High - Low)
R3 = xHigh + 2 * (vPP - Low)
R4 = xHigh + 3 * (vPP - Low)
S1 = vPP-(High - vPP)
S2 = vPP - (High - Low)
S3 = xLow - 2 * (High - PP)
S4 = xLow - 3 * (High - PP)
If you have any questions or suggestions pls write me :)
Happy trading
Cheers
Daily Version:
Weekly Version:
Pivot Points Weekly - bitcoin by Simon-RoseWeekly Version:
I have written 3 Indicators because i couldn't find what i was looking for in the library, so you can turn each one on and off individually for better visibility.
This are Daily, Weekly and Monthly Pivot Points with their Resistance and Support Points
and also on the Daily with the range between them.
I will also publish some Ideas to show you how to use them if you are not familiar with the traditional pivot points strategy already.
Unlike the usually 3 support & resistances i added 4 of them, specifically for trading bitcoin (on traditional markets this level of volatility usually never gets touched)
Here you can see which lines are what for reference, as the Feature to label lines is missing in Pinescript (if you have a workaround pls tell me ;) )
This is the basic calculation used :
PP = (xHigh+xLow+xClose) / 3
R1 = vPP+(vPP-Low)
R2 = vPP + (High - Low)
R3 = xHigh + 2 * (vPP - Low)
R4 = xHigh + 3 * (vPP - Low)
S1 = vPP-(High - vPP)
S2 = vPP - (High - Low)
S3 = xLow - 2 * (High - PP)
S4 = xLow - 3 * (High - PP)
If you have any questions or suggestions pls write me :)
Happy trading
Cheers
Daily Version:
Monthly Version:

Pivot Points Daily - bitcoin by Simon-RoseDaily Version:
I have written 3 Indicators because i couldn't find what i was looking for in the library, so you can turn each one on and off individually for better visibility.
This are Daily, Weekly and Monthly Pivot Points with their Resistance and Support Points
and also on the Daily with the range between them.
I will also publish some Ideas to show you how to use them if you are not familiar with the traditional pivot points strategy already.
Unlike the usually 3 support & resistances i added 4 of them, specifically for trading bitcoin (on traditional markets this level of volatility usually never gets touched)
Here you can see which lines are what for reference, as the Feature to label lines is missing in Pinescript (if you have a workaround pls tell me ;) )
This is the basic calculation used :
PP = (xHigh+xLow+xClose) / 3
R1 = vPP+(vPP-Low)
R2 = vPP + (High - Low)
R3 = xHigh + 2 * (vPP - Low)
R4 = xHigh + 3 * (vPP - Low)
S1 = vPP-(High - vPP)
S2 = vPP - (High - Low)
S3 = xLow - 2 * (High - PP)
S4 = xLow - 3 * (High - PP)
If you have any questions or suggestions pls write me :)
Happy trading
Cheers
Weekly Version:
Monthly Version:

Major Mayer MultipleAdjusted version of the BTC Mayer Multiple developed by Trace Mayer www.theinvestorspodcast.com
This version includes two novelties. The first one replaces BTC with Total Market Cap from 2016/2017 (depending on your moving averages) to present and the second is that we consider two Moving Averages to produce more detailed lows.

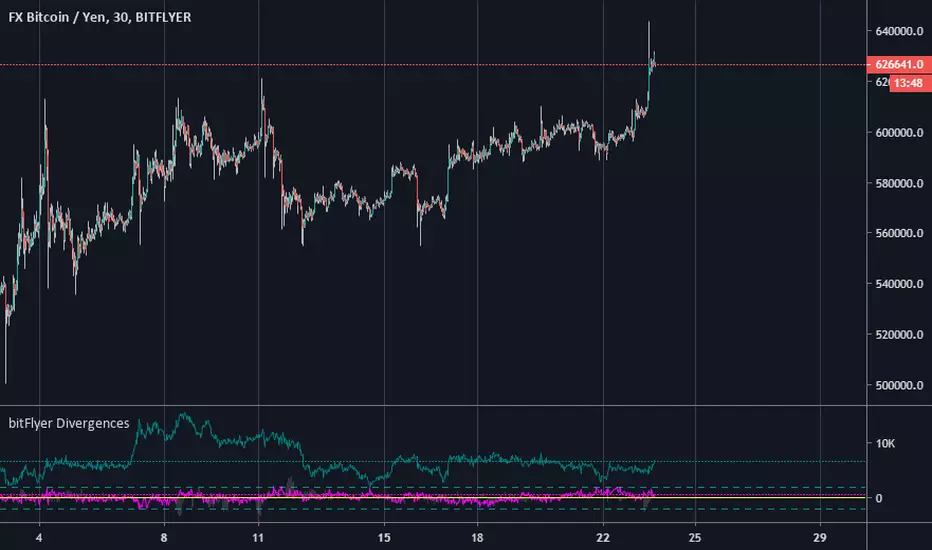
bitFlyer DivergencebitFlyer Divergence.
Basis is BitMEX:BXBT(converted into JPY).
*bitFlyer BTCJPY spot
*bitFlyer FXBTCJPY
Fuchsia(pink) = BTCJPY spot - BXBT
Teal(dark green) = FXBTCJPY - BTCJPY spot
Lime(light green) = BTCspot - BXBT
Mining Cash Flow LineTakes QUANDL Bitcoin blockchain difficulty data, three variables (hashrate in THs/sec, power consumption in kWh, and electricity costs in cents/kWh) and calculates the base line for cash flow in US dollars. The default is an AntMiner S15 at 10 cents/kWh.
When price is above this line, miners with the given conditions have positive cash flow (i.e. they make more money mining than their running costs), and when below the line, they would be better off turning their rigs off (if this simple model can be applied to their particular circumstance).
Assumptions:
1. All costs are consolidated into one "electricity cost" variable, including things like rent and wages for mining farms.
2. 12.5 BTC/block emission schedule (update source code upon next halving).
Warnings:
It is likely that actual costs to miners varies in complex ways. This indicator only shows a cash flow calculation for a very simple set of parameters that will generally apply to miners, but not necessarily all of them. (For example, a miner may be locked into a prepaid contract for cheap electricity, or sell exhaust heat in the winter for extra revenue.)
Positive cash flow is also different from ROI, as this model does not take into account the cost of acquiring an ASIC mining rig.

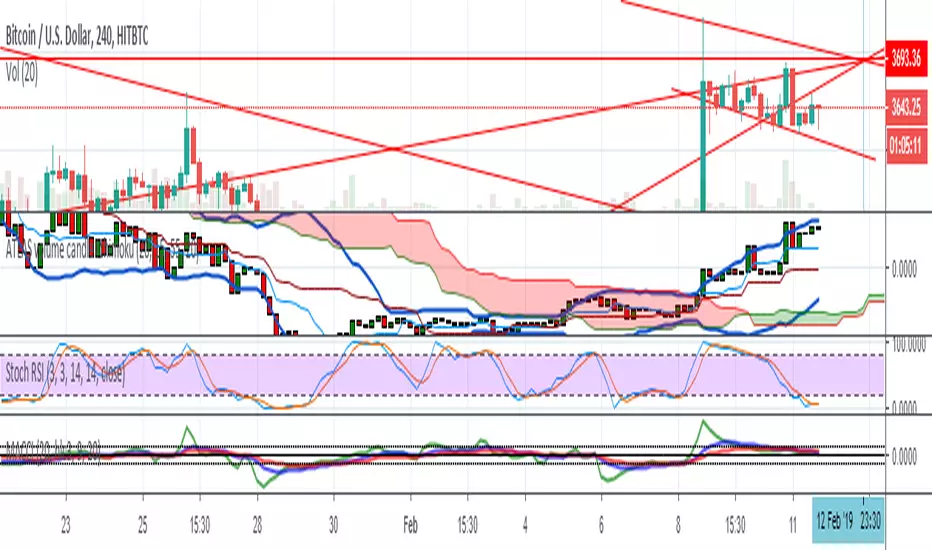
MACCIThrough this oscillator, you can make accurate forecasts in the 4 hour timeframe
As if the green line between 0 and 100 crosses the blue and red lines, it will be below 0 and will not significantly increase before 0.
Hope you can find it of use.
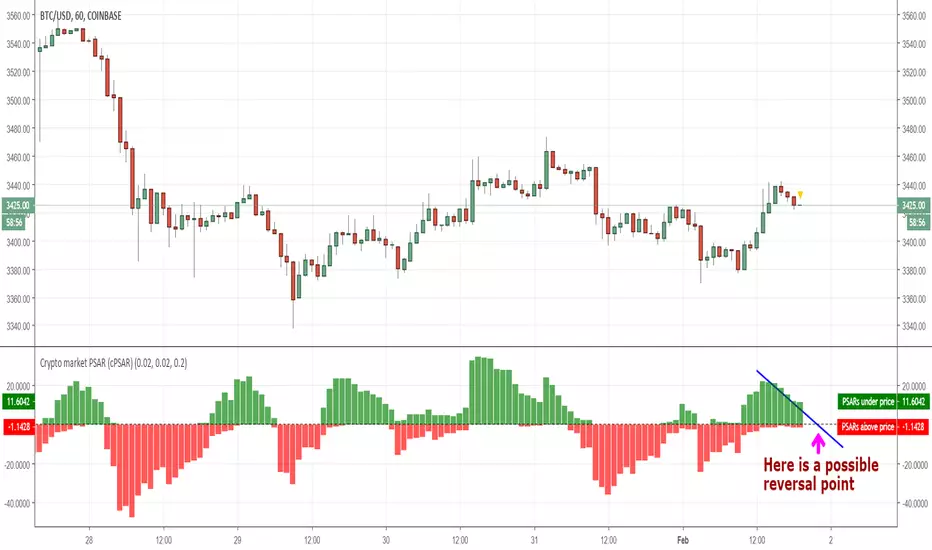
Crypto market PSAR (cPSAR)This indicator calculates the PSARs of the most liquid cryptocurrencies (as percent differences from the prices) and sums them together.
The PSARs under the closes, which act as support, are summed separately and shown in green. The PSARs over the closes (acting as resistance) are summed separately and shown in red.
The result is an indicator which can be interpreted somewhat like the RSI (but keep in mind that PSAR is a lagging indicator unlike the RSI which is a leading indicator). By interpreting this correctly you can - SOMETIMES - predict the short-term turns of the entire crypto market.
Many traders use the prices shown by PSAR (Parabolic Stop And Reverse) to set stop loss prices and/or to take profit and reverse their positions. This is why, on reversal of the PSARs (= when one of the red or green values becomes visibly larger than the other), a strong turning of the market can, sometimes, occur.
Buy The Dip - Does It Work?Buying the dip has become a meme in crypto, but does it actually work?
Using this script you can find out.
The dip is defined here as the average true range multiplied by a number of your choosing (dipness input) and subtracted from the low.
When price crosses under the dip level, a long is initiated. The long is then closed using a timestop (default value 20 bars), no fancy exits here.
A general rule for buying the dip should be to be more passive in a bull market and aggressive in a bear market.
Same goes for all counter trend trading.
Heres a few other examples of dip buying statistics using the H4 timeframe:
50% profitable, 1.692 Profit Factor
BINANCE:PIVXBTC
56.52% profitable, 1.254 Profit Factor
BINANCE:KMDBTC
27.27% Profitable, 0.257 Profit Factor... yikes!
BINANCE:BTSBTC
73.33% Profitable, 13.627 Profit Factor... o.O
BINANCE:MANABTC

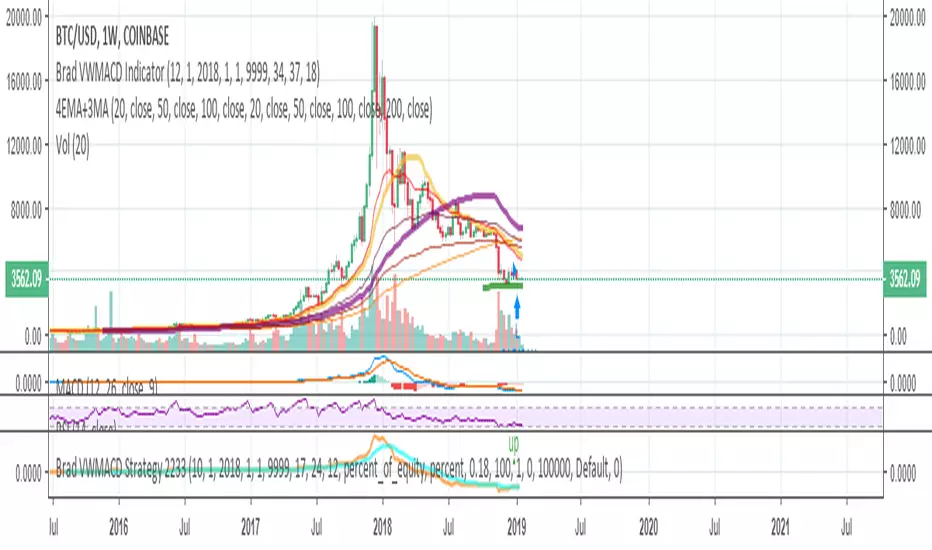
Brad VWMACD Strategy 2233Volume Weighted MACD. DO NOT USE AS STANDALONE. THEY ARE GUNNING FOR yOUR MONeY. Or if you use standalone, use only small fraction of your funds. NOT FINANCIAL ADVICE, PAST RESULTS OFTEN ARE COUNTER TO FUTURE RESULTS. What worked in the past is usually what will NOT work in future.
I tried not to overtune this and it works great some months, terrible other months. EDUCATIONAL PURPOSES ONLY!!!!!!!!!!
Current settings are for 4-hour charts, BTCUSD Coinbase.
Powerfull strategy MACD + RSI + Stoch buy on High exit on ATRMy strategy uses a combination of three indicators MACD Stochastic RSI .
The Idea is to buy when ( MACD > Signal and RSI > 50 and Stochastic > 50) occures at the same time the BUY STop we place on previous day HIGH
We exit on Take profit or Stop loss which is calculated by ATR (10) or on the opposite signal "Volatility breakout"
This strategy works well on stocks, commodities and cryptos especially during market breaking up after consolidation
The best results are on Daily charts , so its NOT a scalping strategy. But it can work also on 1H charts.
The strategy does not have any stops and profit targets, so we can take all the market can give us at the moment.
The exit point only when MACD goes under Signal
Its Preformance is significantly better with "buy stop on High.1" idea and exit on "volatility price breakout"
So, use it, trade it.
If it will help you to imprive your trading results, please donate me
BTC: 12kd1F8buWisUBdq27BBwRkUvzW7Ey3og5


CVD RSI [experiment]This is not really a RSI not either a CVD. This is more like an experiment.
It's a RSI calculation applied on the CVD script i made () instead of a classic RSI based on candle close.
If you have any questions, feel free to ask.

Not really a CVDThis is not really a CVD, more like an experiment.
Because we don't have access to bid or ask volume for BTCUSD/XBTUSD, we can't really make a CVD.
So this one instead is based on the 1 min timeframe. When the 1 min candle is up/green, the volume is positive, but when the candle is down/red, the volume is negative.
An other point is that the "security" function used in the script have an approx max history of 137 days for the 1 min timeframe.
This script is very simple but if you have any questions, feel free to ask.


Aggregated Volume BTCAggregates the Bitcoin volume from multiple exchanges into a single indicator.
# Exchanges and Pairs
Included are only exchanges supported by TradingView:
* Binance
* Bitstamp
* Bittrex
* Coinbase
* Gemini
* itBit
* Bitfinex
* Kraken
* Poloniex
* HitBTC
* OKCoin
* BitMEX
Excluded low volume exchanges (not in CMC Top):
* CEX.IO
* Coinfloor
Excluded low volume pairs (not in CMC Top):
* KRAKEN:XBTCAD, COINBASE:BTCUSDC, ITBIT:BTCEUR, ITBIT:BTCSGD, BITFINEX:BTCJPY, BITFINEX:BTCGBP, POLONIEX:BTCUSDC, OKCOIN:BTCUSD, OKCOIN:BTCCNY
Many other top exchanges are not included, because they are not supported by TradingView.
# Inputs
By default the spot exchanges are selected. You can select also the other margin trading and derivatives exchanges.
# Contribute
Feel free to share any ideas and issues you have.
# Open Source
The code is open source @ github.com and uses the commonpine library github.com
