Always show daily EMAThis script will always plot the daily EMA regardless of which timeframe you are on.
Bitcoin (Crypto-monnaie)

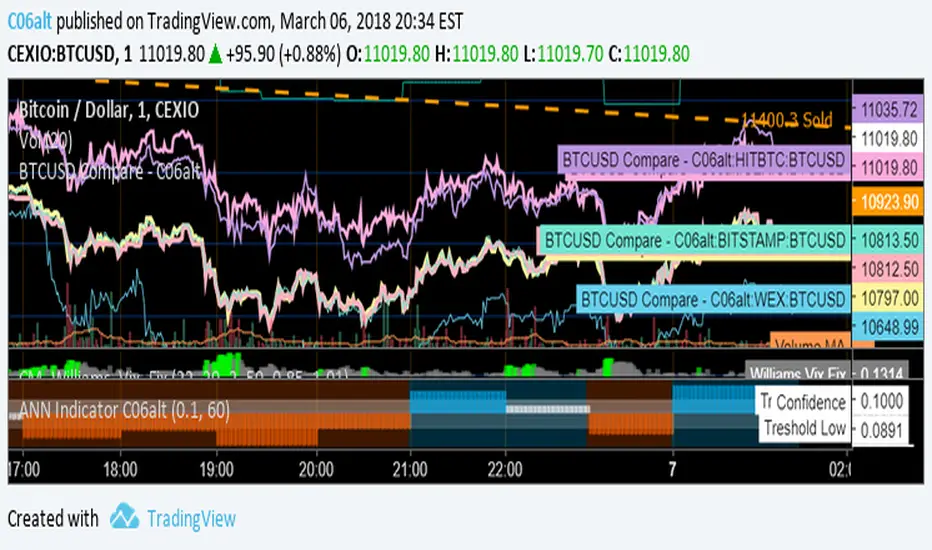
BTCUSD Compare - C06altThis Indicator allows for quick comparison between the BTCUSD exchange closing prices.
Crypto IchimokuIchimoku Cloud with settings recommended for crypto by trader IAmSatoshi. Includes a handy checkbox to double inputs, and alerts that can be set for when the price crosses the bottom or top of the cloud.
This script also includes an ichimoku signal count. The signal count is an UNWEIGHTED sum of positive or negative ichimoku signals with the greatest total being shown in either green(long>short) or red(short>long) or white(0, long==short). The signal count is only shown when their is a new signal or a signal is no longer valid.
If you use a major portion of the code please cite me. If you like the script and make a bunch of money using it, feel free to donate using the crypto addresses below.
BTC: 34uVepgjGJAKqf9i3mfdq8AG1dzTthjCgb
ETH: 0x71B15Beb6AF985853B5fC80205ddb3595C51B63e
LTC: MVzvSu53K5qPfjiQn4nk9D6WVLJKCMzXHJ
DASH: XoKVDBnhiyPvJeyRdpHjcWu1WtVjCbhP68
XMR: 46jnYGp7v5vCSAV8pzGXPbWM7YFiZNB4eaFCHsezitQ46KM1E6FgPM9ZaYJEfDVk5zdKoPQ7vw27ke34jMxERogvJDQhfQW

[Prod] SuperTrend with Stoploss+TrendZones - 1HHere, i'm using a SuperTrend (difference of moving averages) crossover strategy hybrid with stop-loss and trend-following to look at backtesting for the BCHUSD pair on the coinbase (GDAX) exchange.
Included in this script I've got some optimized parameters that seem to make a decent profit over ~35+ trades. The one thing that's bothering me here is that I get OCCASIONAL repaint issues with back-testing, but I can't figure out why for the life of me, because i'm using V3 in the start of the script. If someone could point out the mistake I may be making here , I feel like this could be a serious strategy to use against the BCHUSD pair on coinbase or other exchanges (with tuning of course).
I based this script off of with lots of modifications.

Quadruple Moving Averages For Day TradingQuadruple Moving Averages For Day Trading Crypto
Inputs of 8,13,21,55
Based on chart used by Philakone.

[PW] BITFINEX Shorts ChangeA very simple indicator to show the change of longs between the previous period and the current period on bitfinex, this works for any margin pair on Bitfinex but can also be locked to BITFINEX:BTCUSD, works hand in hand with my "Longs Change" indicator
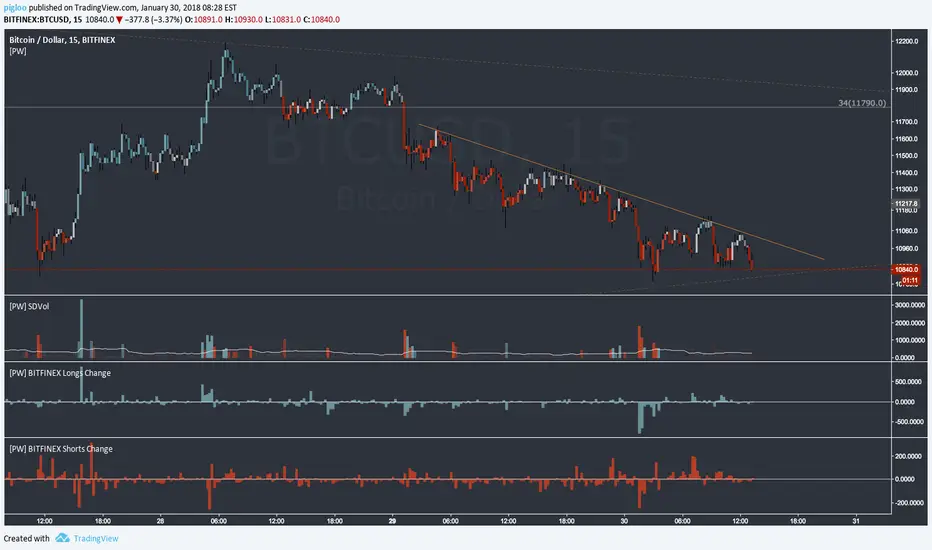
[PW] BITFINEX Longs ChangeA very simple indicator to show the change of longs between the previous period and the current period on bitfinex, this works for any margin pair on Bitfinex but can also be locked to BITFINEX:BTCUSD, works hand in hand with my "Shorts Change" indicator

BTC Price Spread - Coinbase & Futs - Premiums & DiscountsThis indicator takes the price of Bitcoin on Coinbase and the futures price on Mex, and compares it the average price of Bitcoin across other major exchanges.
This essentials give us a spread at which Bitcoin is going for.
In turn, this could be a possible tool to help determine market sentiment.
This indicator was created for experimental purposes.
Use at your own digression.

BTC Futures Settlement DatesShows the CBOE and CME settlement dates as horizontal lines, with the option to show a 7 day warning in the background. This should hopefully give ample warning.
I intend to update the script as new dates become available but please PM if I've forgotten.

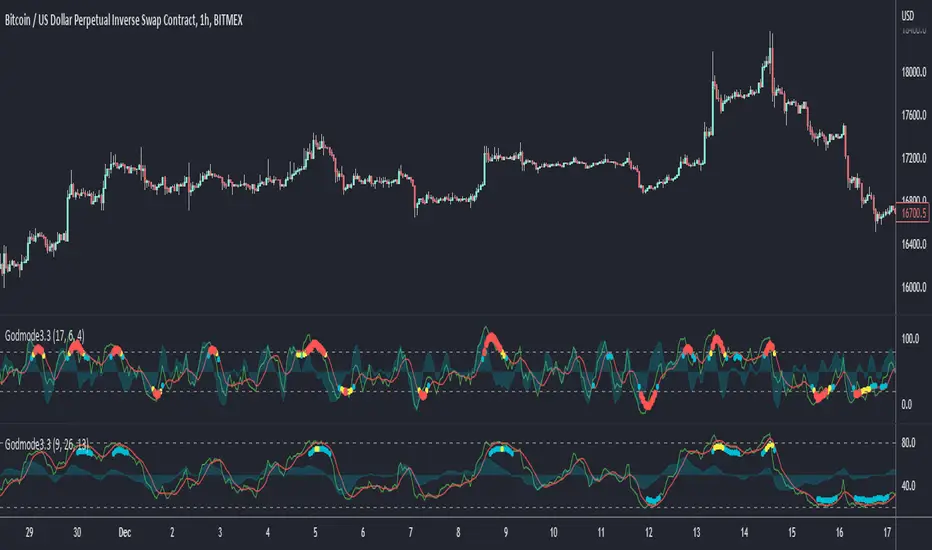
Godmode Oscillator 3.2This is nothing other than an update and slight modification to the original Godmode Oscillator published by xSilas
The update done by sco77m4r7in and myself.
Change Log:
Repaired the multi exchange option for BTC
Added additional 'Caution!' dots with color coding.
white = Early Caution signal
yellow = standard 'Caution!' signal
red = Extreme Caution signal
Be sure to give everyone a big thanks!
Original Godmode Script and Tutorial by xSilas :

Metal worth buyingMetal currently at low price
watch closely for any price drop to buy
keep at least for 2 months

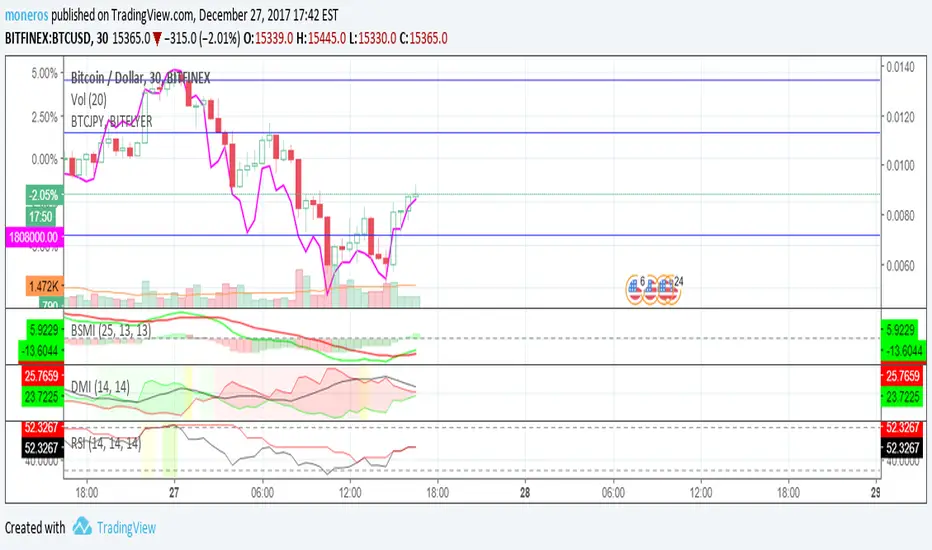
Bitcoin Momentum TSIChart based on True Strength Indicator
It was improved to show same information as Squeeze Momentum Indicator by LazyBear,
but it seems to have better and quicker response to changes and was tested on Bitcoin mainly.
Enjoy it!
BITFINEX:BTCUSD
BTC: CME Futures vs. Exchange SpreadsAs you can see, this script plots the current (10-min. delayed) CME Futures price versus Bitfinex, Bitstamp, and Coinbase prices.
It's displayed here on a 30 minute view because at the time of writing the futures have been alive for approximately one day. The script will likely be more useful on longer time frames as a macro-level indicator.
It's pretty simple to adapt this to additional exchanges

Estimate exchange/broker fee commission from trade volumeThis script is used to estimate how much an exchange/broker makes off a particular pair/symbol. If Coinbase(GDAX) has a 0.25% taker fee and a 0.15% maker fee per trade and you estimate the average commission fee at 0.19% then you simple input that, and how many periods you'd like to know the total fee for (30 periods on the 1 day chart = last 30 days, 28 periods on 4 hour chart = last 7 days, etc).
This is for broad estimates of a single pair and only works well on exchanges that show only the volume on that exchange (stock markets may be less useful for this tool).
THIS TOOL IS TO PROVIDE A BROAD ESTIMATE , NOT AN EXACT FIGURE!
// percentage fee rate is entered as a percent: 3.5=3.5%, not 350%.
// pbtc , the one for calculating the USD value of fees that are in bitcoin, uses the price at time fees were realized. IE chart is on
// 1 day interval and XBARFEE is set at 4, then PBTC gives the USD value as if the exchange sold all btc at the end of each day for
// 4 days. i.e.:
// Day 1: BTCUSD= $5000 fees=1.5, Day 2: BTCUSD = $5000 fees=3.0, Day 3 BTCUSD = $10,000 fees=1.0, Day 4 BTCUSD = $20,000 fees=1.0
// PBTC would NOT show (1.5+ 3 + 1 + 1) = 6.5 * $20k = $130,000. It would do: (1.5*5000)+(3*5000)... = $52,500.

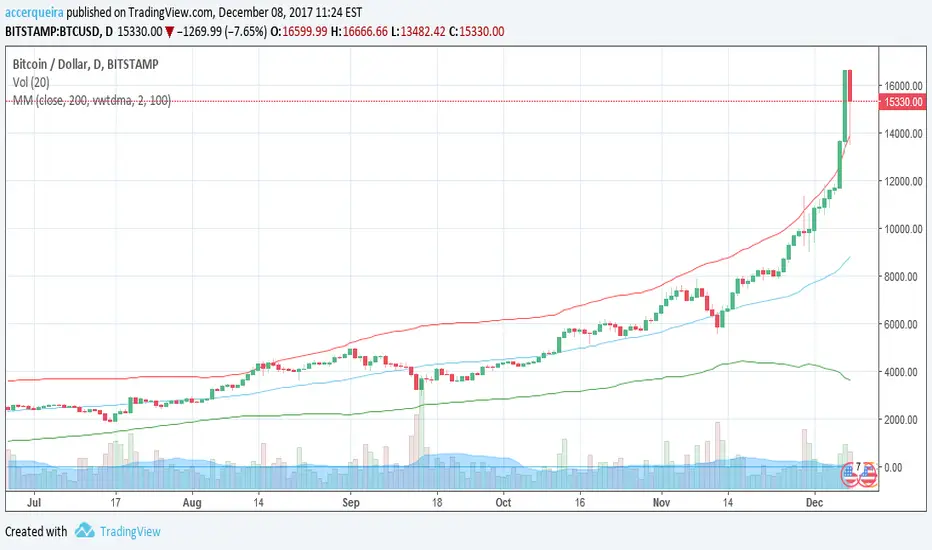
MayerMultiple StochasticThis is an stochastic chart of Price adjusted Mayer Multiple Average Delta.
Moving Average Function can be selected from a list with standard functions and following experimental extras:
- Volume Weighted Exponential Moving Average
- Volume Weighted Time Decayed Moving Average // similar to vwema, but alpha is calculated from length as half-life decay function (not sure if I got that right...)
Default MA function is sma, to keep it true to the original MM indicator, but I think VWEMA and VWTDMA may perform better with exponential nature of Bitcoin .
See also:
Suggestions and bug reports are welcome =)

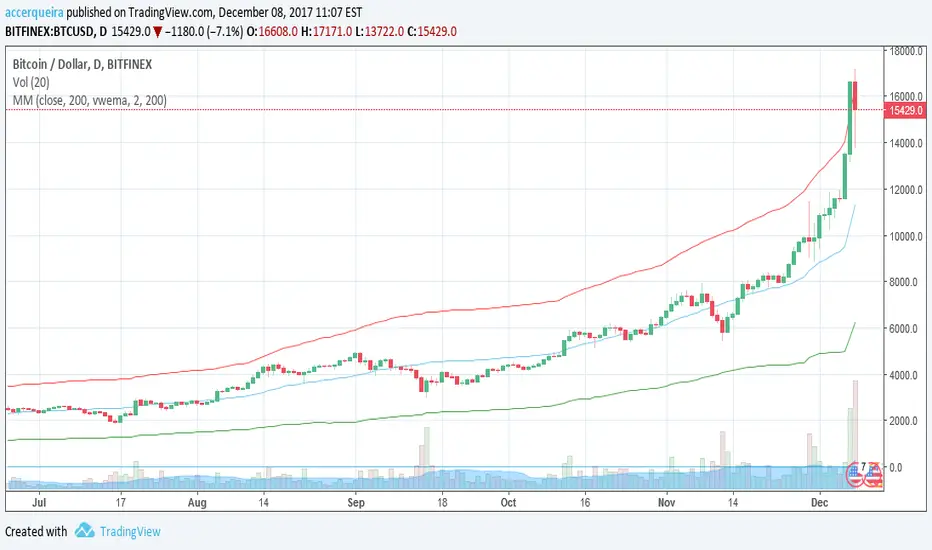
MayerMultiple Price BBThis charts an indicator created by Trace Mayer with some extras.
Plots:
- Mayer Multiple (may be hard to notice, since it overlays by default and stay at the bottom...)
- Price adjusted by Mayer Multiple Average with Bollinger Bands
Moving Average Function can be selected from a list with standard functions and following experimental extras:
- Volume Weighted Exponential Moving Average
- Volume Weighted Time Decayed Moving Average // similar to vwema, but alpha is calculated from length as half-life decay function (not sure if I got that right...)
Default MA function is sma, to keep it true to the original MM indicator, but I think VWEMA and VWTDMA may perform better with exponential nature of Bitcoin .
Suggestions and bug reports are welcome =)
MayerMultiple Price BBThis charts an indicator created by Trace Mayer with some extras.
Plots:
- Mayer Multiple
- Price adjusted by Mayer Multiple Average with Bollinger Bands
Moving Average Function can be selected from a list with standard functions and following experimental extras:
- Volume Weighted Exponential Moving Average
- Volume Weighted Time Decayed Moving Average // similar to vwema, but alpha is calculated from length as half-life decay function (not sure if I got that right...)
Default MA function is sma, to keep it true to the original MM indicator, but I think VWEMA and VWTDMA may perform better with exponential nature of Bitcoin .
Suggestions and bug reports are welcome =)
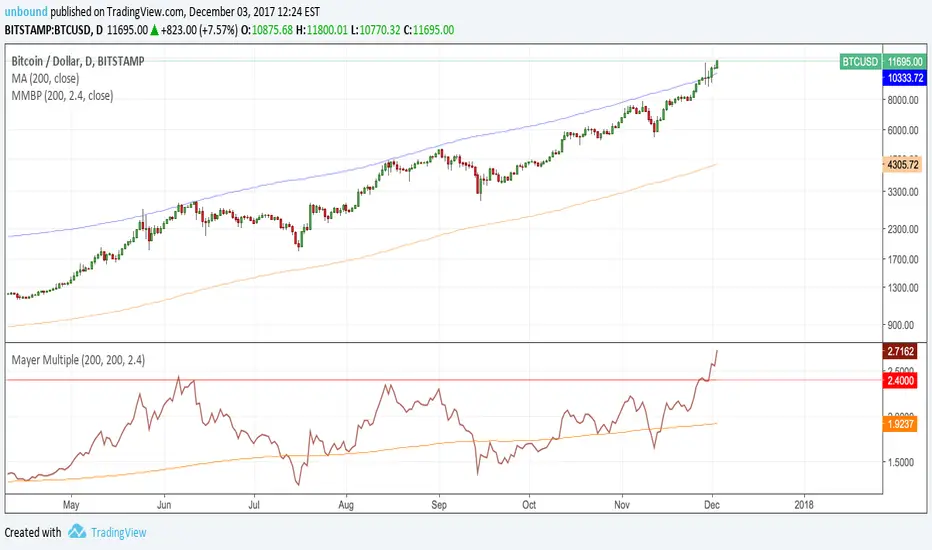
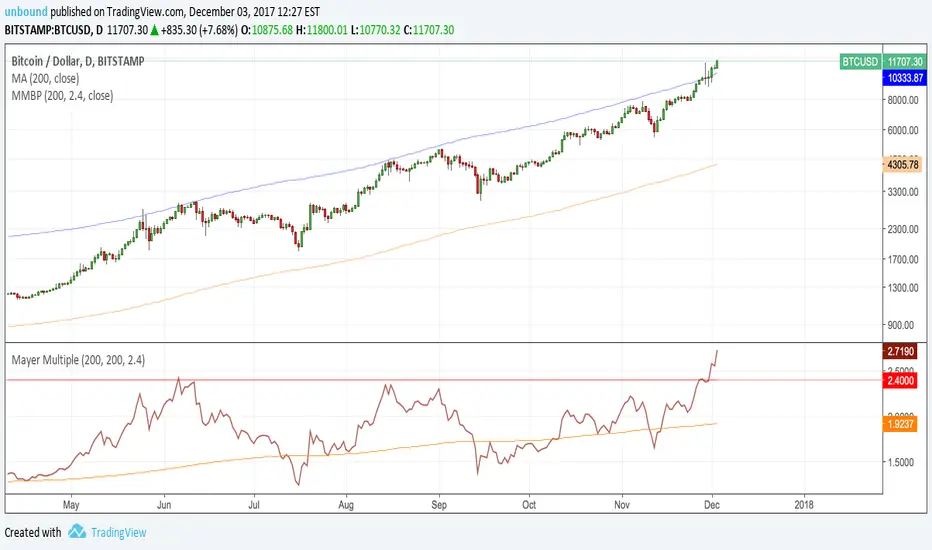
Mayer Multiple v2.0 - Klahr ThresholdThis is a simple update to the Mayer Multiple script by Unbound , which charts an indicator created by Trace Mayer and popularized by Preston Pysh.
The original post identified any price below 2.4x the 100-day MA as the BTC buy threshold. While the logic there is historically sound, it does not account for the fact that the BTC trend is parabolic in nature. With that in mind, I've attempted to update the 2.4x multiple to react based on the moving average of the Mayer Multiple itself. To do so, I simply found the number that, when added to the MM moving average, historically hit the 2.4x multiple during periods of low volatility. This turns out to be 1.17.
The green line represents the Klahr Threshold (is it obnoxious if I call it that? I've always wanted an indicator named after me). As you can see from the above chart, it hovers around 2.4x in late 2012 to early 2013, rises above it until mid 2014, and then stays below until 2016. It then stays almost exactly at 2.4x until April 2017, when it rises significantly above it for the first time since July 2014. The convergence in late 2012 and 2016-2017 is what leads me to believe that this should be the basis for the updated threshold.
It's entirely possible that there's a more robust method of calculating a reactive threshold (or a different number that should be added to the multiple's MA), but I think this is a good first step in refining the multiple to withstand the test of time.

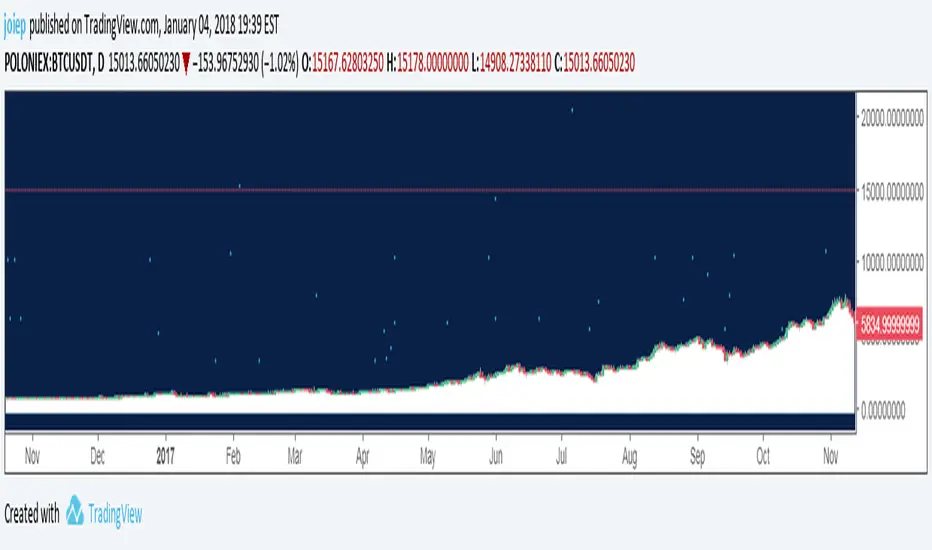
Mayer MultipleFollowing Preston Pysh's "Bitcoin Mayer Multiple" study, I made this simple script to plot the Mayer multiple by calculating the ratio between bitcoin price and its 200-day moving average. It also plots the moving average of ratio itself.
Mayer Multiple Buy PriceFollowing Preston Pysh's "Bitcoin Mayer Multiple" study, I made this simple script to plot the recommended buy price based on the calculated 2.4x ratio between bitcoin price and its 200-day moving average. The ratio and SMA length have default values of 2.4 and 200 and can be adjusted.