Bitcoin CME gaps multi-timeframe auto finder1. Overview
The Bitcoin CME Gap Multi-Timeframe Detector automatically identifies price gaps in the Bitcoin CME (Chicago Mercantile Exchange) futures market and visually displays them on the TradingView chart.
Because the CME futures market closes for about an hour after each weekday session and remains closed over the weekend, price gaps frequently appear when trading resumes on Monday.
This indicator analyzes gaps across six major timeframes, from 5-minute to 1-day charts, allowing traders to easily identify structural imbalances and potential support/resistance zones.
It is the most accurate and feature-rich CME gaps indicator available on TradingView.
2. Key Features
■ Multi-Timeframe Gap Detection
Analyzes 5m, 15m, 30m, 1h, 4h, and 1D charts simultaneously.
This enables traders to observe both short-term volatility and mid-to-long-term structure, providing a multi-dimensional view of market dynamics.
■ Gap Direction Classification
Up Gap: When the next candle’s open is higher than the previous candle’s high (default color: green tone)
Down Gap: When the next candle’s open is lower than the previous candle’s low (default color: red tone)
Gaps are color-coded to intuitively visualize potential support and resistance zones.
■ Highlight Function
Gaps exceeding a user-defined threshold (%) are highlighted (default color: yellow).
This helps quickly identify zones with abnormal volatility or sharp price dislocations.
■ Labels and Box Extension
Each gap displays a percentage label indicating its relative size and significance.
Gap zones are extended to the right as boxes, allowing traders to visually track when and how the gap gets filled over time.
■ Alert System
When a gap forms on the selected timeframe (or across all timeframes), a TradingView alert is triggered.
This enables real-time response to significant gap events.
3. Trading Strategies
■ Gap Fill Behavior
CME gaps statistically tend to get filled over time.
Gap boxes help distinguish between filled and unfilled gaps at a glance.
Up Gap: Price tends to decline to fill the previous high–next open zone.
Down Gap: Price often rises later to fill the previous low–next open zone.
■ Support & Resistance Levels
Gap zones frequently act as strong support or resistance.
When price retests a gap area, observing the reaction of buyers and sellers can provide valuable trading insights.
Overlapping gap boxes across multiple timeframes indicate high-confidence support/resistance zones.
■ Market Sentiment & Volatility Analysis
Large gaps usually result from shifts in market sentiment or major news events.
This indicator allows traders to detect volatility spikes early and prepare for potential trend reversals.
■ Combination with Other Technical Tools
While fully functional on its own, this indicator works even better when combined with tools like moving averages (MA), RSI, MACD, or Fibonacci retracements.
For example, if the bottom of a gap coincides with the 0.618 Fibonacci level, it may signal a strong rebound zone.
4. Settings Options
Minimum Gap % | Sets the minimum percentage movement required to detect a gap (lower values show smaller gaps)
Display Timeframes | Choose which timeframes to display (5m, 15m, 30m, 1h, 4h, 1D)
Box Colors | Assign colors for up and down gaps
Box Extension (Bars) | Number of bars to extend gap boxes to the right
Show Labels | Toggle display of gap percentage labels
Label Position / Size | Adjust label position and size
Highlight Gap ≥ % | Highlight gaps exceeding a specified percentage
Highlight Colors | Set highlight color for labels and boxes
Enable Alerts | Enable or disable alerts
Alert Timeframe | Select timeframe(s) for alerts (“All” = all timeframes)
5. Summary
This indicator is a professional trading tool that provides quantitative and visual analysis of price gaps in the Bitcoin CME futures market.
By combining multi-timeframe detection, highlighting, and alert systems, it helps traders clearly identify zones of market imbalance and potential reversal areas.
Bitcoinsignals

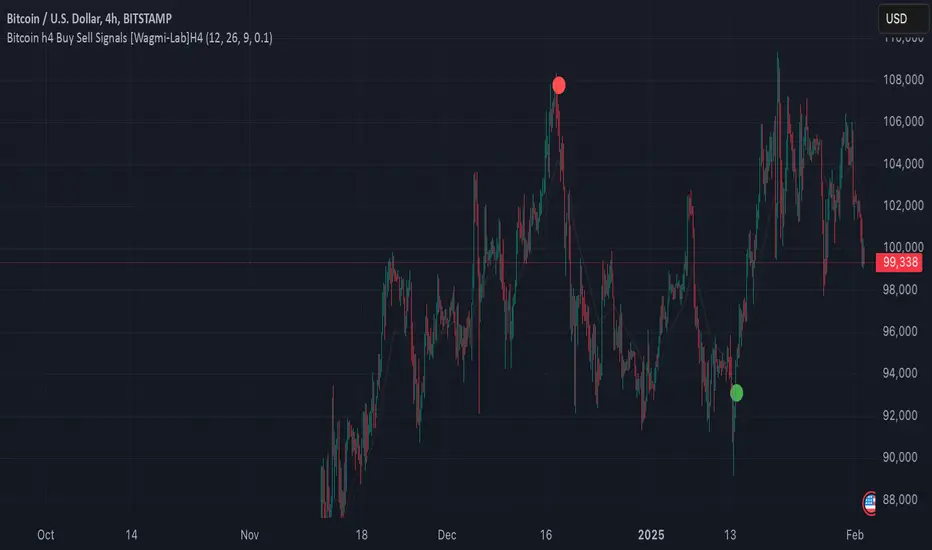
Wagmi Lab- Bitcoin H4 Buy Sell Signals This indicator, designed primarily for Bitcoin on the H4 timeframe, is a versatile tool that can also be applied to other assets and timeframes by adjusting its parameters. It combines Exponential Moving Averages (EMAs), MACD (Moving Average Convergence Divergence), and a crossover filtering mechanism to generate reliable buy and sell signals. The indicator is ideal for traders looking to identify trend direction and potential entry/exit points with added precision.
Key Features:
Customizable EMAs and MACD:
Fast EMA (default: 12): Tracks short-term price momentum.
Slow EMA (default: 26): Tracks long-term price momentum.
Signal SMA (default: 9): Smooths the MACD line to generate the signal line.
MACD Crossover Signals:
The indicator calculates the MACD line and signal line to identify potential buy and sell opportunities.
Buy signals are generated when the MACD line crosses above the signal line, indicating bullish momentum.
Sell signals are generated when the MACD line crosses below the signal line, indicating bearish momentum.
Crossover Strength Filter:
A minimum crossover distance percentage (default: 0.1%) ensures that only significant crossovers are considered, reducing false signals.
This filter helps traders avoid weak or insignificant crossovers that may not lead to strong price movements.
Trend Visualization:
The indicator highlights the trend direction by filling the area between the fast and slow EMAs with colors:
Green: Uptrend (MACD > Signal Line).
Red: Downtrend (MACD < Signal Line).
Buy/Sell Signal Markers:
Buy signals are marked with green circles below the price bars.
Sell signals are marked with red circles above the price bars.
These markers provide clear visual cues for potential entry and exit points.
Adaptable to Other Timeframes and Assets:
While optimized for the H4 timeframe, the indicator can be adjusted for other timeframes (e.g., M15, H1, D1) by modifying the EMA and SMA settings.
It can also be applied to other assets, such as stocks, forex, or commodities, by tweaking the parameters to suit the asset's volatility and characteristics.
How to Use:
Identify Trends:
Use the colored areas (green for uptrend, red for downtrend) to determine the overall market direction.
Wait for Confirmation:
Look for buy or sell signals (green or red circles) that align with the trend direction.
Ensure the crossover meets the minimum distance requirement to filter out weak signals.
Enter and Exit Trades:
Enter a long position when a buy signal appears during an uptrend.
Enter a short position or exit a long position when a sell signal appears during a downtrend.
Adjust Settings for Other Timeframes/Assets:
Experiment with the EMA and SMA periods to optimize the indicator for different timeframes or assets.
Why Use This Indicator?
Precision: The crossover strength filter reduces noise and false signals.
Versatility: Works across multiple timeframes and assets with customizable settings.
Visual Clarity: Clear trend visualization and signal markers make it easy to interpret.
This indicator is a powerful tool for traders seeking to capitalize on Bitcoin's volatility or other assets' price movements, providing a structured approach to identifying trends and potential trading opportunities.
BITCOIN Miners Revenue VS Price Correlation OscillatorUse 3D(3-day candle) as timeframe for best reading.
------
original template for Correlation indicator was created by obaranova. credit goes to her.
