NEESON Plus Crypto Market Sentiment IndicatorCore Features
1. Multi-Factor Sentiment Scoring System
Comprehensive Algorithm: Combines 6 different market indicators
Weighted Scoring: Each factor contributes with different weights
Real-time Calculation: Updates with every new bar
Smoothing Mechanism: Triple EMA smoothing for stable signals
2. Advanced Technical Indicators Integration
Multi-Timeframe RSI: 1H, 4H, and Daily RSI analysis
Volume Analysis: Volume spikes and decline detection
ATR Volatility: Market volatility assessment
MACD Momentum: Trend momentum confirmation
Bollinger Bands: Price position analysis
3. Proprietary Indicator Calculations
AHR999 Proxy: Enhanced version for crypto markets
Puell Multiple Proxy: Dynamic calculation with RSI adjustment
PI Cycle Top: Multi-moving average cycle analysis
CBBI Enhanced: Crypto Bull Bear Index with momentum
Market Volatility Sentiment: Volatility-based sentiment scoring
Volume Sentiment: Volume-based market sentiment
Signal Generation System
4. Multi-Condition Signal Filters
Strong Buy/Sell Signals: Multiple confirmation requirements
Warning Signals: Early entry/exit indications
Confirmation Bars: User-configurable signal confirmation
Trend Filter: Optional trend alignment requirement
Volume Filter: Volume spike confirmation
Volatility Filter: ATR-based market condition filtering
Momentum Filter: MACD momentum confirmation
5. Advanced Signal Management
Signal State Tracking: Maintains current position state
Duration Tracking: Tracks how long signals have been active
Entry Score Recording: Records sentiment score at entry
Consecutive Signal Counting: Prevents signal flipping
Exit Conditions: Multiple exit criteria for risk management
Visualization Features
6. Professional Chart Display
Dual Score Plotting: Comprehensive and raw sentiment scores
Color-Coded Background: Real-time market sentiment coloring
Threshold Lines: Clear visual reference levels
Area Fills: Colored zones for different sentiment levels
Signal Markers: Visual indicators for buy/sell signals
7. Information Panel
Real-time Data Display: Current scores and signals
Position Tracking: Duration and entry information
Performance Metrics: Floating P/L calculation
Market Status: RSI, Volume, Volatility, MACD status
Configuration Status: Current filter settings
Customization Options
8. User-Configurable Parameters
Threshold Settings: Adjustable buy/sell/exit levels
Filter Toggles: Enable/disable various filters
Indicator Periods: Customizable calculation periods
Color Settings: Fully customizable color scheme
Signal Duration: Minimum signal duration requirements
9. Alert System
Strong Buy/Sell Alerts: Immediate notification for strong signals
Warning Alerts: Early signal notifications
Custom Alert Messages: Clear, descriptive alert texts
Multiple Timeframe Compatibility: Works across all timeframes
Risk Management Features
10. Built-in Protection Mechanisms
Signal Confirmation: Prevents false signals
Exit Triggers: Multiple exit conditions
Position Duration Limits: Automatic exit after prolonged periods
Profit/Loss Tracking: Real-time performance monitoring
Volatility Adjustment: Adapts to market conditions
Technical Specifications
11. Performance Optimization
Efficient Calculation: Optimized for real-time performance
Multi-Timeframe Support: Works on all chart timeframes
Resource Management: Controlled line and label counts
Precision Control: Adjustable decimal precision
12. Compatibility
Cryptocurrency Focus: Specifically designed for crypto markets
Multi-Asset Support: Works with all TradingView symbols
Platform Compatibility: Fully compatible with TradingView platform
Mobile Support: Responsive design for mobile devices
Usage Benefits
Comprehensive Analysis: Single indicator providing multiple insights
Clear Signals: Easy-to-understand buy/sell indications
Customizable: Adaptable to different trading styles
Risk-Aware: Built-in risk management features
Professional Grade: Institutional-level analysis tools
User-Friendly: Intuitive visual interface
Educational: Helps understand market sentiment dynamics
This indicator is designed to provide traders with a comprehensive market sentiment analysis tool specifically optimized for cryptocurrency markets, combining traditional technical analysis with crypto-specific metrics.
BNB

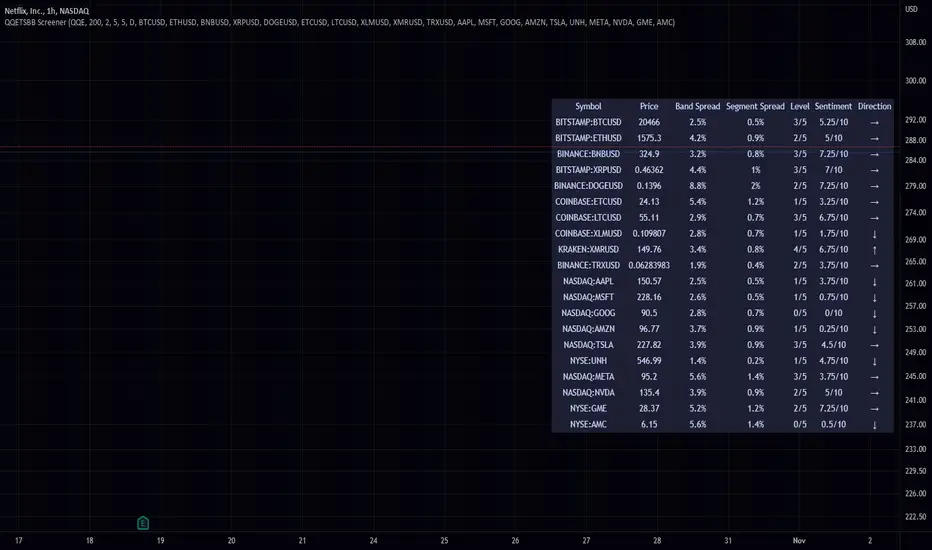
QQE Student's T-Distribution Bollinger Bands ScreenerThis script scans 20 custom symbols and displays the QQE Students T-Distribution Bollinger Bandwidth as a percentage, the quarter segment percentage, a score that tells you what segment of the band the price is in, and what direction the market is going in. This is useful because it can tell you how volatile a market is and how much reward is in the market. It also tells you what direction the market is going in so you can pick a symbol that has the best looking reward. I really hope that this script complements the group of indicators I have made so far. Here is a list of the other two indicators related to this script.
Please enjoy!
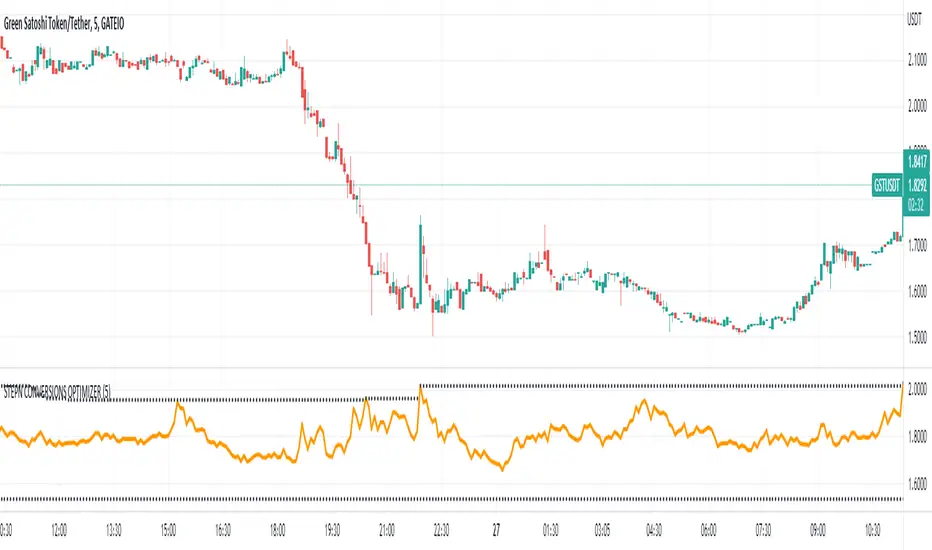
STEPN CONVERSION OPTIMIZERThis is a very simple indicator that anyone can use but it is especially geared towards STEPN users who often have to switch between different tokens (GST, GMT, SOL, BNB).
The idea of the indicator is that at a glance you can know if it is a good time or not to make a conversion. What the indicator does is divide the value of the token that we have by the one that we want to change in each bar and with this data a graph is created with which you know how much you are going to receive for each token and how much you would have received at any other time.
It is completely configurable for any conversion between STEPN tokens, you can also include two dotted lines that indicate when the maximum and minimum conversion rate has been reached, which makes it very easy to know where you are.
The data collection is independent of the graph on screen so it's great to have it on screen waiting for the ideal moment for the change while you do other things.
The timeframe is also configurable in case you are not very interested in precision, by default the data is taken from the 5-minute chart.
I created this indicator for myself but seeing how useful it is to me and that not only am I not losing money like before but I am even earning money with conversions, I have decided to share it.
Feedback would be appreciated and if you like it and find it as useful as it does for me, show some love.
InvictusHello,
I introduce my strategy that provide signals for entering in the market and signal for exit.
This indicator attempts to show a trader when is the best time to open a long or short position. The calculations are partially based on volatility, SMA, EMA and predefined values depending on used timeframe.
We collect data from comparing the current price, calculating the average move of the market, top, bottom and close of the latest bars. The middle line is an adaptive moving average, which is the base of the signals and we also use it as a Trend Line to determine if we are in long or short "condition". The basic idea of this indicator is to show the best place to open a Long or Short position and when to close it.
It is very simple - there are 2 type of signals - LONG (in green) and SHORT (in red). You can close your position when a TP (Take profit) shows up or based on your calculations.
You can chose from several options which strategy you want (there is a "Strategy" select in the settings). The strategies that are proving better according to our tests are marked with a diamond.
Don't forget to always trade with caution, trading is dangerous don't trade more than you can afford to lose.
Please contact me via personal message if you want to test the strategy or for more information.
Thank you.

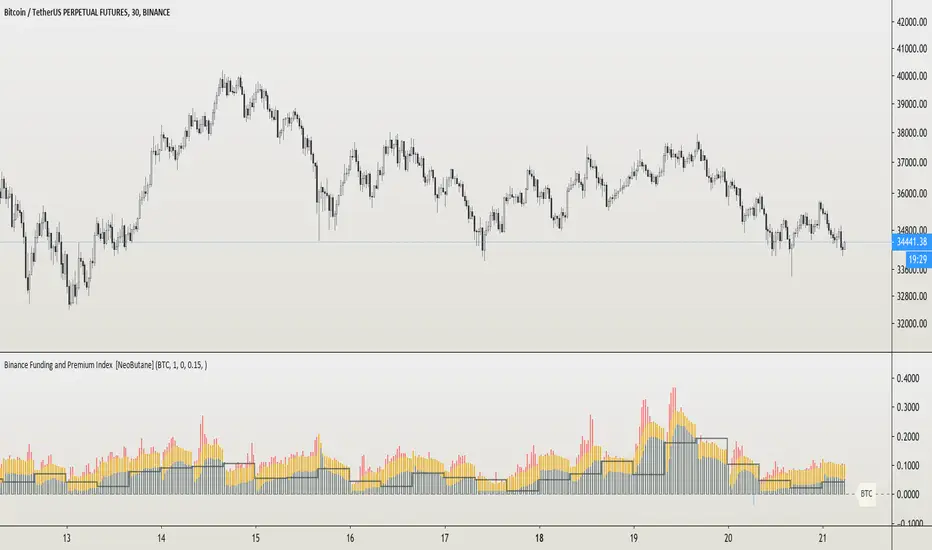
Binance Funding and Premium Index [NeoButane]A premium index indicator for Binance exclusively. This version includes BTC, ETH, and BNB.
Just like BitMEX, there is a +/- 0.05% clamp with 0.01% being the default. Funding periods occur at 0000 UTC, 0800 UTC, and 1600 UTC.
Binance documentation does not mention a maximum funding rate, so instead there is an option to limit how much is funding/premium is displayed if it is too extreme.
There are alarm conditions that can be set for any coin's premium crossing above or below the set amount as well as visualizations for the premium level set.
Helpful notes:
ETHUSD on BitMEX is a quanto swap and shorting it incurs more risk. That is a partial explanation as to why premiums for ETH swaps are lower on other exchanges. See here for more info:
insights.deribit.com
The final funding rate is derived from the premium index and paying/receiving interest happens only if a position is held. Since interest is handled between traders, you may see significant moves when funding is very high or low.
This is a paid indicator, please DM for access
Golden Ratio Fibonacci Multipliers Top Detector [UO]Fibonacci levels that show the critical top and bottom levels. There is no way to miss the top and bottom. And a top detector.
Also the most important SMA lines (SMA 50, 200), EMA21. Those are the most frequently used lines by traders.
This indicator is based on the work of www.tradingview.com
His work set me thinking. Could I also see the bottom using Fibonacci numbers? Yes, of course.
My favorite timeframes with this indicator are 6H, 1D, 3D.
Intensively used for BTC and BNB. And useful for any other coin.


What is ProfitableBTC, BNB or your favorite Alt Coin? This indicator shows what is profitable at the moment. Red bars are alt days, green bars are BTC days. Otherwise, it is a BNB day.
Hmm, most of the time it is a BNB day!

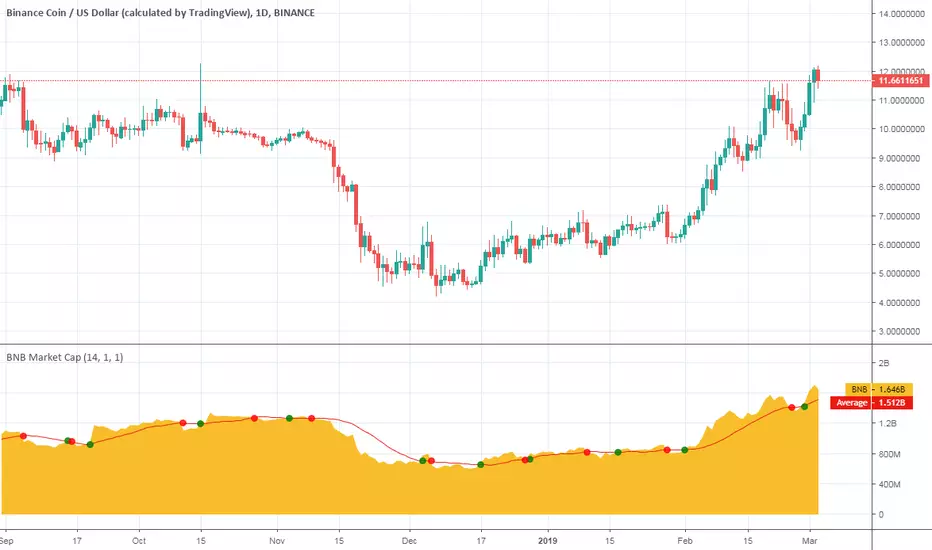
Binance Coin Market CapHey there!
This is Binance Coin market cap with some additional features.
Consider it as my Christmas gift to the community.
What is included
Dynamic market capitalization chart
Customizable SMA of the market capitalization
Crossovers highlighting
You can set alerts for crossovers
Alert for the specified positive % change
Alert for the specified negative % change
NOTE : The word "Dynamic" means that I did not hardcode the supply of the presented coin. You can check it over time.
Good luck and happy trading!
Bull ComparisonBull Comparison is a script that compares the Bull trends for upto 10 coins. This could be dizzying, so for starters start with 3 coins and turn off the 7 remaining in the settings. Default 3 coins are BNB, BTC, ETH USDT. User can customize the coins they want to check, just follow the format in the settings - to see if there is meaningful correlation with other pairs.
