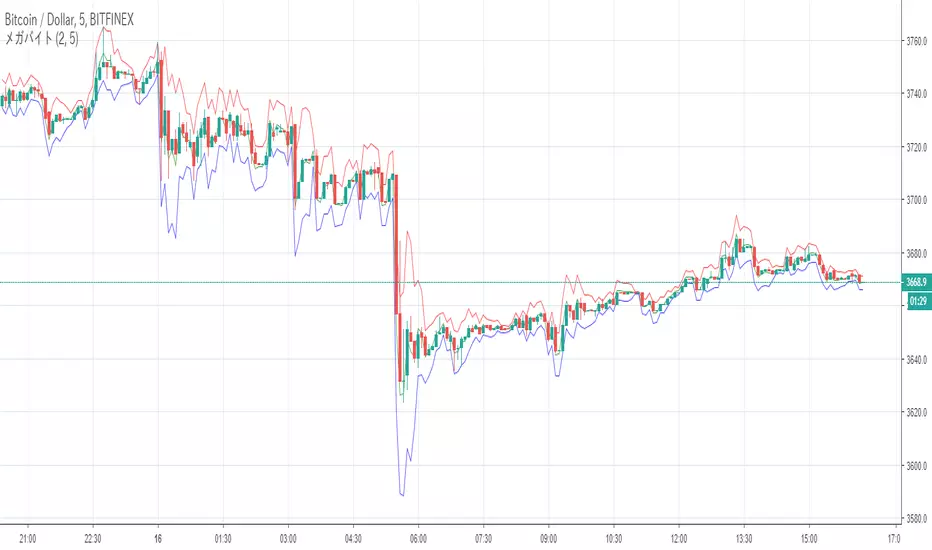
MTF BB Meow Mix [acatwithcharts]This script adds multi-timeframe support to full BB Meow Mix, with the full set of various moving average and stdev calculation types.
There is a tradeoff in that there is, to the best of my knowledge, no way to support both MTF and the default band settings menu in the same script, because the security() function in Pinescipt doesn't support variable lookback lengths and trying to plot everything independently instead maxes out the number of plots allowed per script. So, this version of the script doesn't include a menu of defaults.
My volatility indicators are available by subscription in several packages through SharkCharts.live.
Current pricing and subscription details will be kept up-to-date on SharkCharts.live
Bandes de Bollinger (BB)

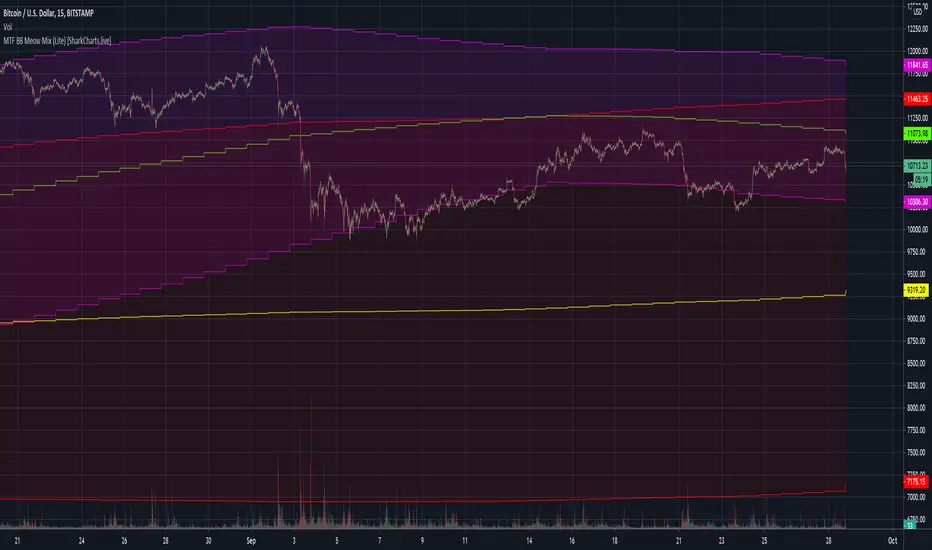
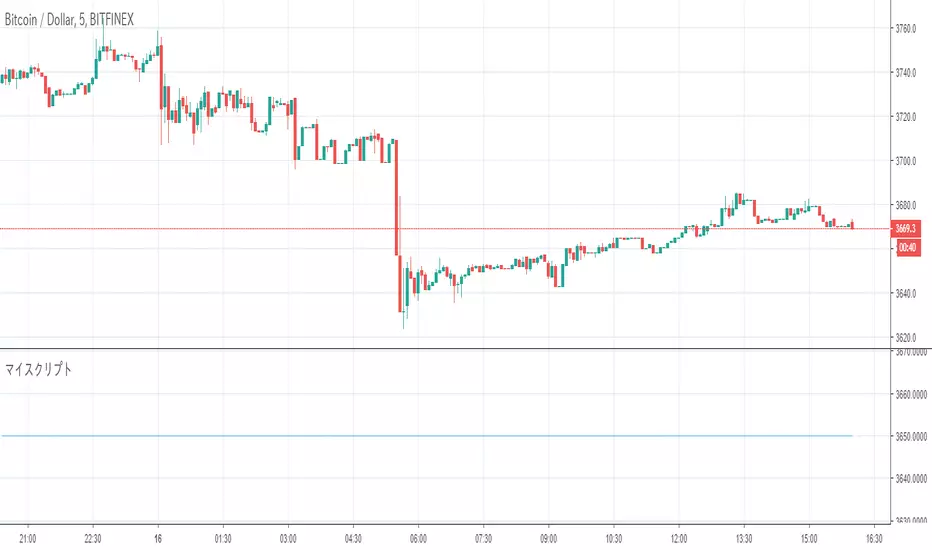
MTF BB Meow Mix (Lite) [acatwithcharts]This script adds multi-timeframe support to BB Meow Mix (Lite).
There is a tradeoff in that there is, to the best of my knowledge, no way to support both MTF and the default band settings menu in the same script, because the security() function in Pinescipt doesn't support variable lookback lengths and trying to plot everything independently instead maxes out the number of plots allowed per script. So, this version of the script doesn't include a menu of defaults.
My volatility indicators are available by subscription in several packages through SharkCharts.live.
Current pricing and subscription details will be kept up-to-date on SharkCharts.live
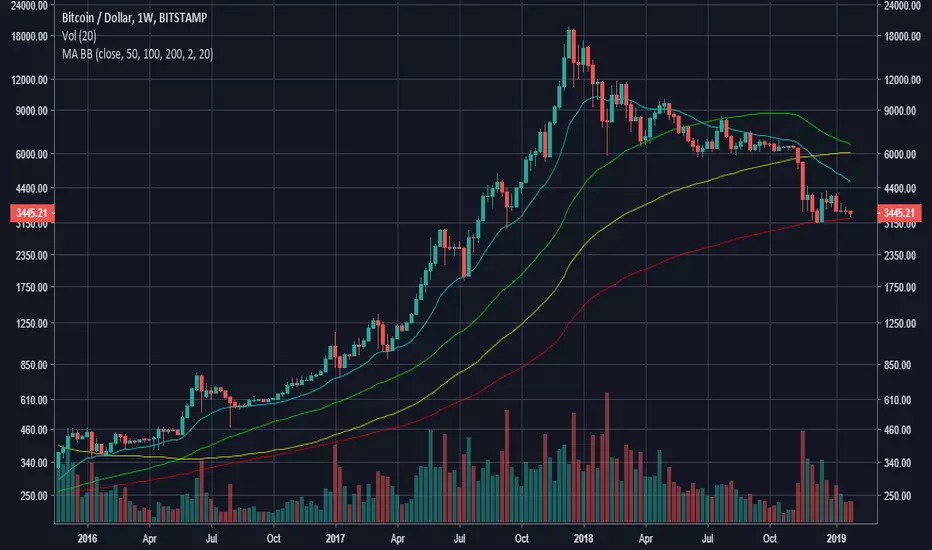
Moving Averages & Bollinger Bands3 Moving Averages and Bollinger Bands in 1 Indicator
SMA or EMA
Exponential Bollinger Bands available
Turn bands on or off
Customize period length and standard deviations
4 Ichimoku Clouds 2 BB by Theo ParkYou can use 4 Ichimoku Clouds and 2 Bollinger Bands with this indicator

Bollinger ratioSo this indicator is hybrid of MACD and Bollinger
The aim here is to see where the direction of the Bollinger is going to the zero up or down . if it above the zero line or bellow it
I add bullish area and bearish area by the ratio of donchian channel

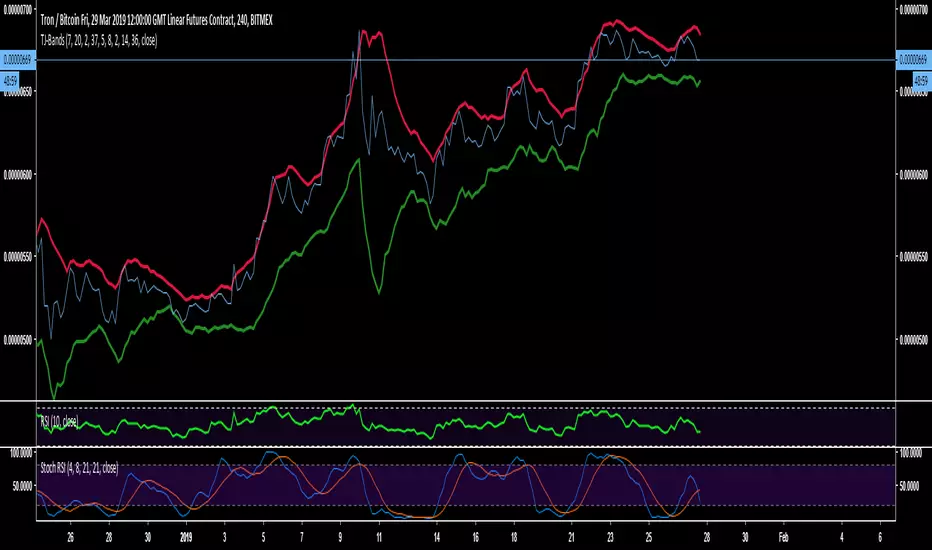
TJ-BandsDo you want to know
This indicator is a modified form of Bollinger Bands.
It works in a similar way like BB does. If you take a look at the "line" chart, you will clearly see, that a close outside these bands is very unlikely and works very well as a rejection line for the chart.
Since, the chart is likely to get rejected at the bands those have been indicated red at the top and green at the bottom.
The use is very simple, add it to your chart and there is nothing more to modify or change.
Like and Follow me and you will find this page interesting because I am a TA expert and professional day trader in crypto since 2012 that does daily updates and new posts about the hottest and most discussed coins.
Cheers, TJ
DMIBBDirectional movement indicator for assessing price direction and strength. DMI tells you when to be long or short, differentiatING between strong &weak trends. DMI works on all time frames and applicable to any asset.
DMI is a moving average of range expansion over an input period. The positive directional movement indicator (+DMI) measures how strongly price moves upward; the negative directional movement indicator (-DMI) measures how strongly price moves downward. The two lines reflect the respective strength of the bulls versus the bears. Which DMI lines is on top is the dominant DMI. The dominant DMI is stronger and more likely to predict the direction of price. For the buyers and sellers to change dominance, the lines must cross over.
Added feature is Bollinger Bands to moderate signals.
Bollinger Bands MTF [LonesomeTheBlue]With this script you can follow Bollinger Bands for current and higher time frame together. Higher time frame is calculated by script.
if current period
1m => higher period=5m
3m => higher period=5m
5m => higher period=15m
15m => higher period=1h
30m => higher period=1h
45m => higher period=1h
1h => higher period=4h
2h => higher period=4h
3h => higher period=4h
4h => higher period=1day
1day => higher period=1week


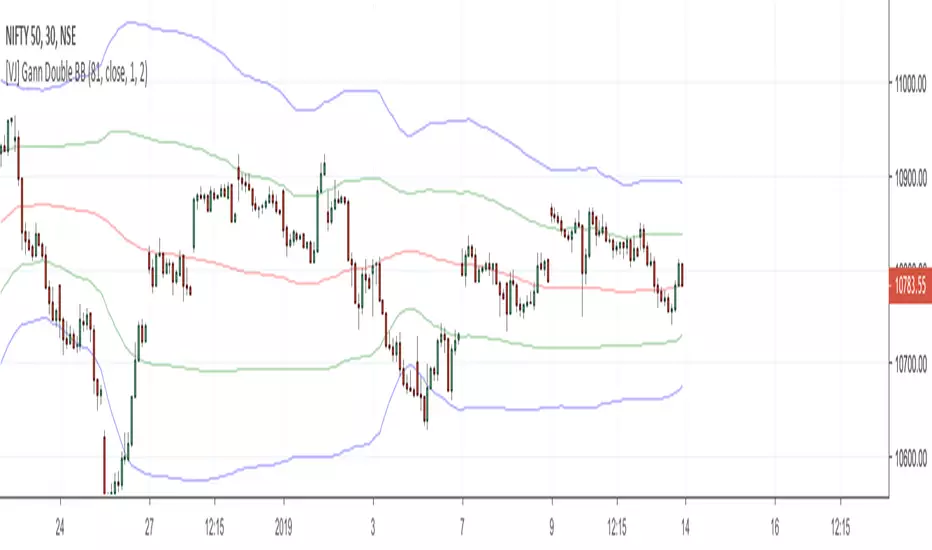
[VJ] Gann Double BBTry to form rules around this. Very profitable - start from - 2SD to +1SD for buy with intermediate bands as SL. vice versa for sell


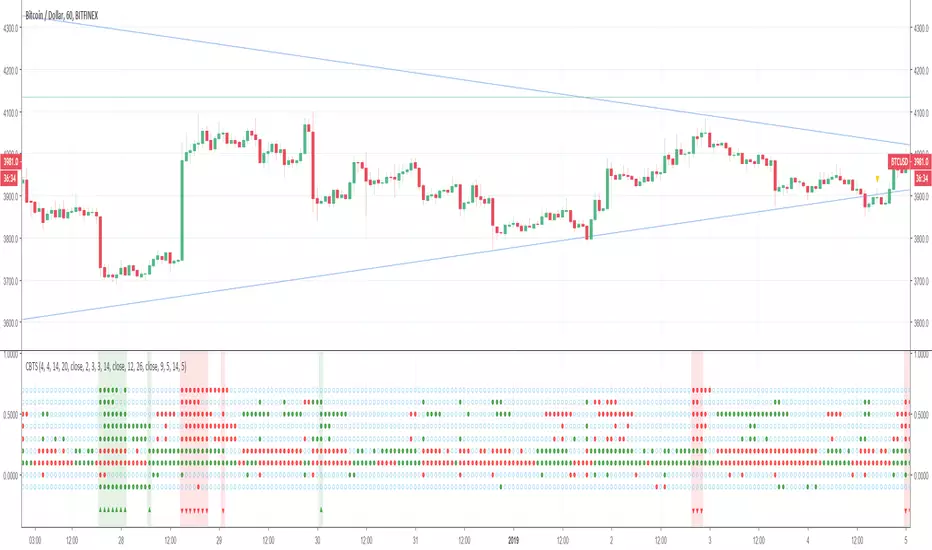
CryptoPeep Trade Signals (6 In 1)I am always looking at different indicators, and wanted a quick way to check my favorite 6 indicators in one for a quick check on crypto trades.
This script includes the following, in order from top to bottom.
1). RSI
2). Bollinger Bands
3). Stochastic RSI
4). Stochastic Only
5). MACD
6). Weighted Moving Avg.
If the indicator show a buy/oversold that corresponding line will go green and red if overbought. if undecided with be a white circle.
If there are 4 showing the same the background will change to match.
Hope it helps, please tel me know your thoughts.
If you would like to be kept up to date please FOLLOW us and try our indicators and strategies here: uk.tradingview.com
Please click the LIKE button if you use it.
21EMA & Bollinger BandsSimple scalping strategy
Buy/sell on confirmation of price crossing the centre EMA line, price bouncing off the outer bands, or both.

Stochastic Bollinger Strategy (Wicks)See 'Stochastic Bollinger Strategy' for details on how this works.
tips/donations are always appreciated venmo @rick-munoz

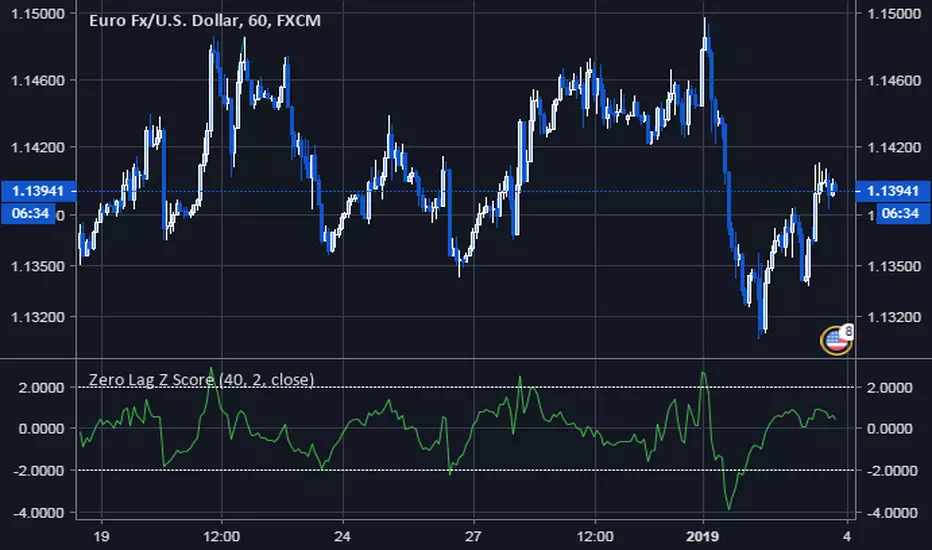
Zero Lag Z ScoreThis is a Zero Lag version of Z Score. It essentially uses ZEMA (Zero Lag EMA) as its moving average, and then plots how many deviations (positive or negative) input price is from the ZEMA. A Centered Oscillator version of Zero Lag Bollinger Bands
Quad Bollinger BandsSimple quad bollinger band indicator, allowing people without pro subscriptions to apply multiple bb's under one indicator.
Bollinger Bands %BA better Bollinger Bands %B indicator with coloring and alerts.
Note: I'm using dark theme and white colored lines are good to me, if you are using white background, you can adjust the colors on Style section.

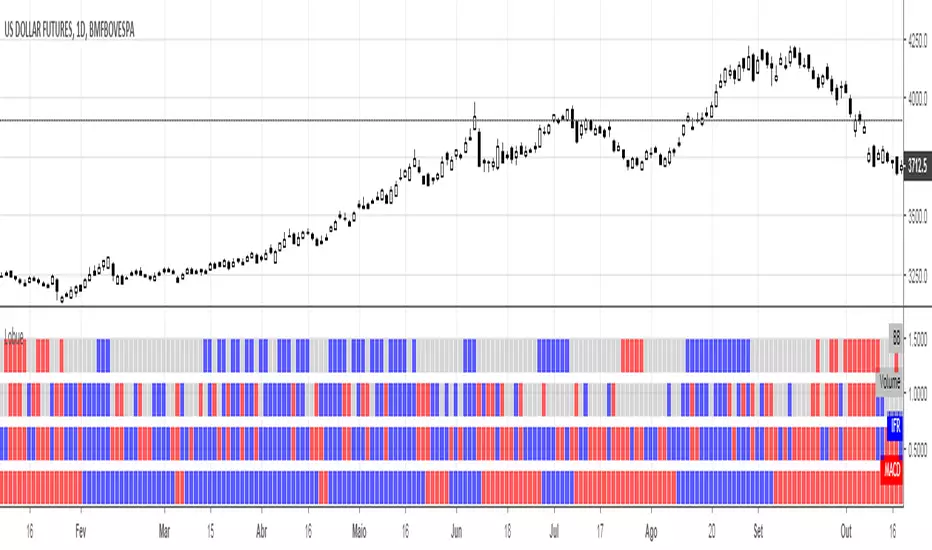
Lobue - colours flags.This script was built to be used in the future dollar market of B3 (Brazil), however, it could be applied in any market.
The differential of this indicator is that it is a group of indicators, which makes it difficult to fit into the existing categories in TradingView.
In spite of adding several technical indicators, it manages to make the screen very clean, since the conditions of the indicators are signaled by colored flags aligned with the current price.
This way of visualizing the indicators allows the use of several of them in a simple and without indecision.
In the current script are added the technical indicators: MACD, IFR, Volume with your average and Bollinger Bands, but with customizations, this script can adapt easily to the most varied technical indicators, without limit on the number of indicators and the coloring conditions.
Trend Lines and MoreMulti-Indicator consisting of several useful indicators in a single package.
TREND LINES
-By default the 20 SMA and 50 SMA are shown.
-Use "MOVING AVERAGE TYPE" to select SMA, EMA, Double-EMA, Triple-EMA, or Hull.
-Use "50 MA TREND COLOR" to have the 50 turn green/red for uptrend/downtrend.
-Use "DAILY SOURCE ONLY" to always show daily averages regardless of timeframe.
-Use "SHOW LONG MA" to also include 100, 150, and 200 moving averages.
-Use "SHOW MARKERS" to show a small colored marker identifying which line is which.
OTHER INDICATORS
-You can show Bollinger Bands and Parabolic SAR.
-You can highlight key reversal times (9:50-10:10 and 14:40-15:00).
-You can show price offset markers, where was the price "n" periods ago.
That last one is useful to show the level of prices which are about to "fall off" the moving average
and be replaced with current price. So for example, if current price is significantly below the
200-days-ago price, you can gauge the difficulty for the 200 MA to start climbing again.
