inwCoin BB Break Risk% Strategy.=========================
English
=========================
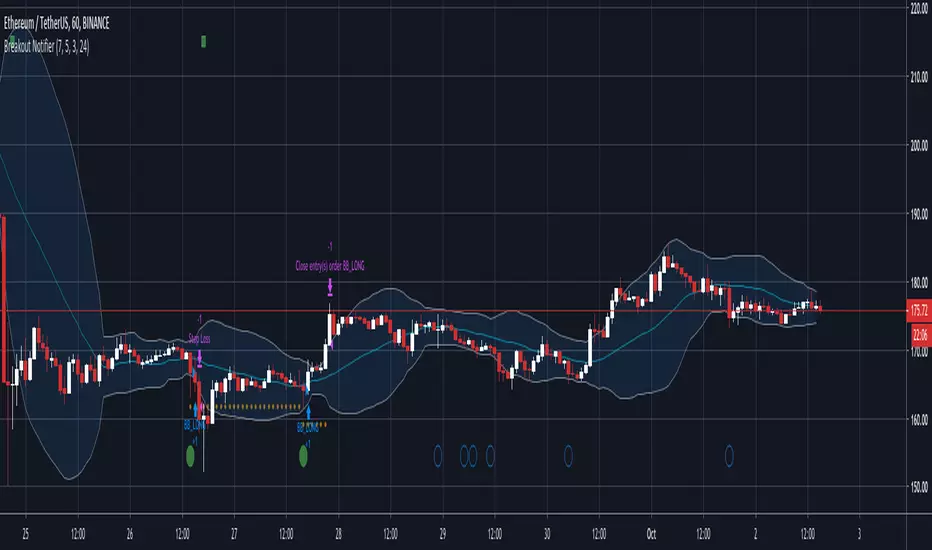
Simple yet effective strategy
when Bollinger Bands squeeze tight, the next thing will be the explosion of price in any direction.
This proven profitable if you choose to play long only.
BB Break and close above previous value = buy
Price crossunder basis line = sell
==========================
Thai
==========================
bollinger band strategy โดยใช้หลักการที่ว่า
ถ้าราคาปิดเหนือ หรือใต้ BB ก็ให้ออก position ไปในทางนั้น ( ปิดเหนือ ออก long ปิดใต้ออก short )
โดยจะทำการปิด position ถ้าราคามา cross เส้น basis ( เส้นกลาง MA20 )
เท่าที่ Backtest ได้ผลลัพธ์ที่ค่อนข้างน่าพอใจครับ
เทรดไม่มาก แล้วก็ได้กำไรพอสมควร ( แต่ก็สู้ buy & hold ไม่ได้อยู่ดี แต่เราเล่นแบบคุมเสี่ยงไงครับ 55 )
Bandes de Bollinger (BB)

Breakout Notifier LONG NEW with wicksBreakout script with few changes that considers wick to close trades instead of using candle body like in the previous version

Breakout Notifier SHORT With wicksBreakout notifier with modifed version to close on wicks instead of candle body

Breakout Notifier LONGLong trades based on our breakout logic, params you can configure are Stop Loss and breakout % to track

Makenai Chart Strategy Trial(日本語による説明は こちら から)
Each hourly foot can display the moving average line for the same period of time in the same color.
The average moving line that you want to see is displayed by time leg, as well as the long-term Bollinger band that should be noticed by the time leg.
1. You can get a lot of useful information at a glance by displaying the moving average line of the long-term and period setting that many traders are aware of.
○ The period setting of the moving average line displayed in each time and foot is not fixed as usual, but changed the period by time and foot, and the moving average line of the same color is the same.
It is a moving average line of time (for example, an hourly average line and a four-hour average line).Therefore, the market price is always the same even if the time to see changes
You can see it on a scale.It doesn't happen when you look at it in five minutes, but when you look at it in four hours, it looks like a downward trend.
○ The sensitivity of the rate to the moving average line displayed is very high.
You can see how rate moves, such as trends, are determined, and you can see reality in abstract chart moves
I can feel it.Purple 24 hours (one day) moving average line with 1 minute to 4 hours of foot, Green 1 week moving average line with 5 minute to day.
The sensitivity to the Blue Monthly Movement Average Line, which is displayed from 5 mins to 5 weeks, and Red One Year Movement Average Line, which is displayed from 1 hour to 5 weeks, is very high.
Just look at whether the rates are moving up or down the moving average line and you'll be able to decide what to look for.
○ What is the positional relation between the moving average line of seven (eight in addition to the weekly moving average line) in the short, short, medium, medium, long, and long periods?
To make the direction and intensity of the trend easier to recognize, it is colored between moving averages to be visible as short- and medium-term clouds.
The three clouds changed color to warm rising clouds and cold falling clouds, depending on the relation of the moving averages.
·Strong upward trend rates when all clouds are unified in either upward or downward direction and are arranged in the order of short-term, medium-term or long-term clouds
·The thickness of the clouds is strong, and when the thickness is increased, the trend rate is strong.
·Trendless market when clouds overlap or the colors of the clouds are mixed
• Range price when rates are moving back and forth between clouds
You can visually and intuitively understand the market conditions, such as .
○ Short-term, short-term, medium- and short-term positional relationships will indicate the timing of the entry payment and the direction of the long-short.It's also written.
In conjunction with this, the duration for which the background color should be long changes to light warm color and warm color, and the duration for short changes to light cold and cold color.
2. The long-term Bollinger band is displayed so that you can trade with the higher time base than the time base you see.
○ You can ride on a long-term trend by detecting and entering the trend occurrence of long-term feet with short-term feet.
Buy high prices, sell low prices, relax your trend-follow-style tears, and enable stress-free entries.
○ A light, transparent gray filter is displayed between the long-term foot Bollinger band ±1σ which sets the period suitable for the time and foot.
I understand that while the rate is moving in this zone (called gray zone), it is difficult to trend and the price range is small, so it should not be taken care of.
Yes, you can use this filter to prevent deception when the volatility is not present, and if you are out of the filter, you can use the above sign.
By trading in accordance, you can invest in trend-follow tiles while avoiding losses in range markets.
○ Bolinger bands generally display six of ±1σ, ±2σ and ±3σ, but in this indicator, two are inside ±1σ and two are outside ±3σ.
We have added a total of four bands.The former sets up early entries and the latter sets up new reverse positions, expecting a market shift from overheating.
for tips on how to
○ Expansion period (expansion period) due to characteristics of the Bollinger band is a period when volatility is big for trade, and a squeeze period
(Shrinking period) I understand that the volatility is small and it is not suitable for trade.Also, it's a squeeze period, but it's not
You can seize investment opportunities by making you expect the timing to move from contraction to expansion and by watching.
※Valid time difference by series
Multi Time : 1 minute, 5 minutes, 15 minutes, 30 minutes 1 Hour, 4 Hour, Daily, Week (Total 8 Hours)
Long Time Span : 1 hour, 4 hour, daily, 4 long-term
Short Time Span : 1 minute, 5 minutes, 15 minutes, 30 minutes
Trial (1n & 1h) : 1 min.
※See here for details of the indicator and how to use it.
★ for "Indicator Grant" and "Market Analysis Information and Indicator Signature Distribution Service" by LINE Group (for a fee)
If you wish, please send a message on private chat
Discord:
discord.gg


DAX Shooter 5M StrategyThis is a simple strategy that applies very well for scaling indices to 5 minutes especially for the DAX. The algorithm provides for buying or selling when the market is very "pulled". The rules are as follows:
you buy when:
1- The ADX indicator with the standard settings is greater than 32.
2- the RSI indicator set to 7 periods is crossing upwards the oversold line at 30
3- the candle minimum is lower than the lower band of bollinger bands set to 50 periods.
is sold when:
1- ADX indicator with standard settings is greater than 32.
2 - the RSI indicator set to 7 periods is crossing downwards the overbought line at 70
3- the maximum of the candle is higher than the upper band of the bollinger bands set to 50 periods.
Money management is at the discretion of the trader but usually it is better to set a fixed stop loss and a take profit on reaching the opposite bollinger band.
Enjoy trading at all!

DAKELAX-XRPUSDT Bollinger Band Strategy for TradebotlerDAKELAX-XRPUSDT is a Tradebotler strategy designed to run on XRPUSDT for binance, it's a simple reverse to mean strategy and when backtested on may-aug 2019 on H1 timeframe it performs pretty well in backtest as well as running live.
In order to get started install the Tradebotler extension and connect the strategy with Binance or other crypto exchanges of your choice such as Kraken, Bitstamp, Bitmex, Bittrex, Polyneux etc, etc.

Bollinger Band Strategy (Basic) Version 1 This strategy is for learning purposes only. Pay special attention to these strategies on longer aggregation periods (like 1 hr chart or more). Don't expect accurate results when you set a limit to 10 cents above your entry to be accurate. For example if you set the chart to 1 day, the price may move down and hit a stop 10 times then tag your limit. If this doesn't make sense, just don't use strategies here. Learn more first. That being said, I don't have specific recommendations for each aggregation period, backtesting isn't always perfect.
Now then, this strategy can be used as the traditional BB method by setting the "Stop" and "Limit Out" to like 10000, check "Reversal Entry" and uncheck "Limit Time of Day" This will keep the strategy running just reverse your position when price crosses outside each band.
INPUTS:
Length - length of WMA that I used for mean of Bollinger Band (this may suppose to be SMA, too bad)
Source - O-H-L-C basis for WMA
Deviation - normal Standard deviation that would be set when using Bollinger Band
Trailing stop check box - your stop value will be either a hard stop or trailing stop for an exit
Stop - the stop value - remember you can set this really high and it won't stop out
Limit Out - the limit value for exit
Reversal Entry check box - This changes each entry from a reversal (traditional idea of BB) to enter a trend trade - hopefully version 2 will have choice to trend one direction and reversal in the other.
Limit Time of Day - Especially when trading futures, you may want to only trade a specific time of day, when this box is checked, you can set the entry times below, exit will still only occur based on limit/stop or a flip entry order (the opposite entry condition is met)
Tips:
when I don't know a thing about a price range, like gold. I can set the limit out to 10000 and play with a trailing stop to get a better idea of what is even possible before tuning further.

Makenai Chart Strategy Full(日本語による説明は こちら から)
Each hourly foot can display the moving average line for the same period of time in the same color.
The average moving line that you want to see is displayed by time leg, as well as the long-term Bollinger band that should be noticed by the time leg.
1. You can get a lot of useful information at a glance by displaying the moving average line of the long-term and period setting that many traders are aware of.
○ The period setting of the moving average line displayed in each time and foot is not fixed as usual, but changed the period by time and foot, and the moving average line of the same color is the same.
It is a moving average line of time (for example, an hourly average line and a four-hour average line).Therefore, the market price is always the same even if the time to see changes
You can see it on a scale.It doesn't happen when you look at it in five minutes, but when you look at it in four hours, it looks like a downward trend.
○ The sensitivity of the rate to the moving average line displayed is very high.
You can see how rate moves, such as trends, are determined, and you can see reality in abstract chart moves
I can feel it.Purple 24 hours (one day) moving average line with 1 minute to 4 hours of foot, Green 1 week moving average line with 5 minute to day.
The sensitivity to the Blue Monthly Movement Average Line, which is displayed from 5 mins to 5 weeks, and Red One Year Movement Average Line, which is displayed from 1 hour to 5 weeks, is very high.
Just look at whether the rates are moving up or down the moving average line and you'll be able to decide what to look for.
○ What is the positional relation between the moving average line of seven (eight in addition to the weekly moving average line) in the short, short, medium, medium, long, and long periods?
To make the direction and intensity of the trend easier to recognize, it is colored between moving averages to be visible as short- and medium-term clouds.
The three clouds changed color to warm rising clouds and cold falling clouds, depending on the relation of the moving averages.
·Strong upward trend rates when all clouds are unified in either upward or downward direction and are arranged in the order of short-term, medium-term or long-term clouds
·The thickness of the clouds is strong, and when the thickness is increased, the trend rate is strong.
·Trendless market when clouds overlap or the colors of the clouds are mixed
• Range price when rates are moving back and forth between clouds
You can visually and intuitively understand the market conditions, such as .
○ Short-term, short-term, medium- and short-term positional relationships will indicate the timing of the entry payment and the direction of the long-short.It's also written.
In conjunction with this, the duration for which the background color should be long changes to light warm color and warm color, and the duration for short changes to light cold and cold color.
2. The long-term Bollinger band is displayed so that you can trade with the higher time base than the time base you see.
○ You can ride on a long-term trend by detecting and entering the trend occurrence of long-term feet with short-term feet.
Buy high prices, sell low prices, relax your trend-follow-style tears, and enable stress-free entries.
○ A light, transparent gray filter is displayed between the long-term foot Bollinger band ±1σ which sets the period suitable for the time and foot.
I understand that while the rate is moving in this zone (called gray zone), it is difficult to trend and the price range is small, so it should not be taken care of.
Yes, you can use this filter to prevent deception when the volatility is not present, and if you are out of the filter, you can use the above sign.
By trading in accordance, you can invest in trend-follow tiles while avoiding losses in range markets.
○ Bolinger bands generally display six of ±1σ, ±2σ and ±3σ, but in this indicator, two are inside ±1σ and two are outside ±3σ.
We have added a total of four bands.The former sets up early entries and the latter sets up new reverse positions, expecting a market shift from overheating.
for tips on how to
○ Expansion period (expansion period) due to characteristics of the Bollinger band is a period when volatility is big for trade, and a squeeze period
(Shrinking period) I understand that the volatility is small and it is not suitable for trade.Also, it's a squeeze period, but it's not
You can seize investment opportunities by making you expect the timing to move from contraction to expansion and by watching.
※Valid time difference by series
Multi Time : 1 minute, 5 minutes, 15 minutes, 30 minutes 1 Hour, 4 Hour, Daily, Week (Total 8 Hours)
Long Time Span : 1 hour, 4 hour, daily, 4 long-term
Short Time Span : 1 minute, 5 minutes, 15 minutes, 30 minutes
Trial (1n & 1h) : 1 min.
※See here for details of the indicator and how to use it.
★ for "Indicator Grant" and "Market Analysis Information and Indicator Signature Distribution Service" by LINE Group (for a fee)
If you wish, please send a message on private chat

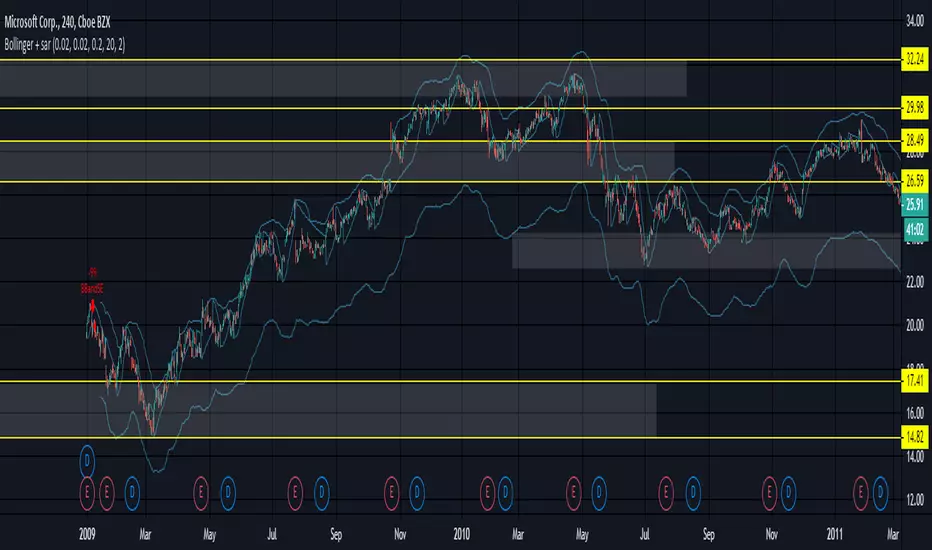
Bollinger + sarProblem with change in bollingerbands when adding psar short condition - and i dont know why.
Anyone - any ideas?
Bollinger Bands & Standard Deviation & ADX strategyBollinger Bands & Standard Deviation & ADX strategy
BB => SMA / EMA select
ADX => SMA / EMA / RMA select

Kozlod - Simple BB Strategy - XBTUSD - 1 minuteReally nice performance for simple BB on XBTUSD Bitmex 1 minute chart.
BB length = 55, BB mult = 4.
No SL or PT used.
Amazingly performance for the last week, 92% profitable. Tested on entire May percent profitable become 80%, still not bad.
And remember:
Past performance does not guarantee future results.

APEX - Swing Aura StrategyA backtester of my new strat, it's a hybrid swing/scalp strat that really looks for quick low profits. Will keep it hidden as it's a bit of a work in progress right now. Working on it to perform well enough with the Apex Trading bot, ran it for a day now and it ended the day on a 1.78% portfolio profit, so I'm really pleased with that.
As for details it's based on Keltner Channels, Bolingers Bands and a Ichimoku cloud. To spice it up there's even a Wave trend in there as well!
All the settings for the bits and parts are changeable so feel free to mess around with them, but will keep my sell triggers fixed for now, so no editing of those from within the script unfortunately.
Enjoy!

Kozlod - Simple BB Strategy - XRPBTC - 1 minutePretty good performance of simple BB on XRPBTC 1minute chart.
No SL or PT used.
And remember:
Past performance does not guarantee future results.

Bollinger and Tendencies (Bollinger e Tendências )The strategy consists of buying when the price breaks up (crossover) the bottom line of the Bollinger and selling when the price breaks down (crossunder) to your top line.
The chart still shows trends clearly, with the fill between the exponential average and the closing value of the canlestick, green at high, red at low (this part of the script is based on the code: "Pivot Daily Price Color" by Rimko).
It also places notes on the high and low candlesticks (based on the code: "Candlesticks Pattern Identified" by Repo32).
It is recommended to use it in conjunction with the "IFR and Storage" script (also available to me), and some volume script.
A estratégia consiste em comprar quando o preço rompe para cima (crossover) a linha inferior do Bollinger e vender quando o preço rompe para baixo (crossunder) a sua linha superior.
O gráfico ainda mostra as tendências de forma clara, com o preenchimento entre a média exponencial e o valor de fechamento do canlestick, verde em alta, vermelho em baixa (essa parte do script é baseada no código: "Pivot Daily Price Color" do usuário: Rimko).
Também, coloca apontamentos nos candlesticks de alta e de baixa (baseado no código: "Candlesticks Pattern Identified" do usuário Repo32).
Recomenda-se a utilização em conjunto com o script "IFR e Estocagem" (também por mim disponibilizado), e algum script de volume.

MBY_Bigginer Pack(1.8 for prototype)this indicator help your trade.
just one indicator showing, but you get more.
1. bollinger bands
2. pibotnachi support / resistance line (1H)
3. ichimoku clouds ' base line
4. movingaverage lines with macd colors.
+ strategy about bollinger bands with candle stick patterns.
enjoy it.
+ this version just for test about "Repainting" , i hope it just gonna be OK.


BB + RSI testThis is a back-test tool for the BB + RSI indikator
- Set your gain percentage and the rest of your parameters and see how does it work on a chart.
- The pyramid buying is on by default you can turn it off in indicator settings/properties

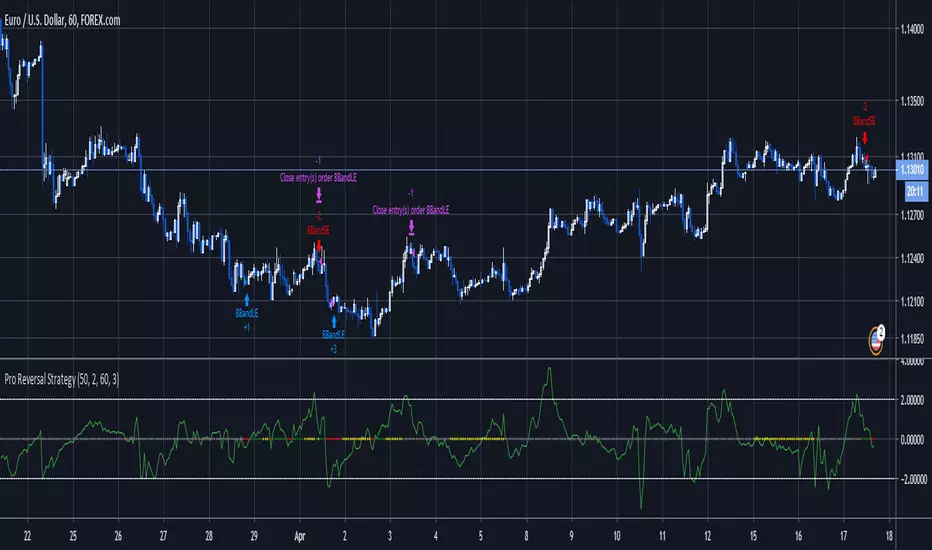
ProZ Reversal StrategyThis is a mean reversion strategy that I have backtested extensively on other platforms and personally trade.
It works best on currency pairs, although it also works very well in all markets if you have a bullish/bearish bias and only take trades in a single direction, or in a range-bound market.
Ask for a 3-day free trial and pricing.
Thanks!
Tangram Bot 2 - SmartbotPrimeira Versão do Script Tangram Bot 2 da Smartbot para tradingview.
A intenção é agilizar e fazer um teste prévio e rápido do setup.
O resultado indicado aqui jamais corresponderá a um resultado real. É apenas uma ferramenta de estudo.
Ainda falta fazer e melhorar a parte de gestão de risco.
Caso queria fazer alguma sugestão ao cógido para melhorar a gestão de risco ou caso tenha encontrado algum erro, favor comunicar.
O tangram bot 2 combina o uso de até dez Indicadores de Análise Técnica com Gerenciamento de Risco (stop gain, stop loss, stop móvel, realização parcial, bloqueio de reversões, lucro máximo por dia e prejuízo máximo por dia) e Filtros Diversos (sentido das operações, uso do after-market, bloqueio de nova entrada após saída, hora inicial e hora final para negociação). São utilizados os indicadores Médias Móveis, HiLo Activator, MACD, ADX, Estocástico, VWAP, IFR, Bandas de Bollinger, Stop ATR e SAR Parabólico
