Best TradingView Strategy - For NASDAQ and DOW30 and other IndexThe script is totally based on momentum , volume and price. We have used :
1: Bollinger Band Squeezes to know when a breakout might happen.
2: Used Moving Averages(SMA and EMA) to know the direction.
3: The success Rate of this strategy is above 75% and if little price action is added it can easily surpass 90% success mark.
4: Do not worry about drawdowns , we have implemented trailing SL ,so you might see a little extra drawdown but in reality its pretty less.
5: I myself have tested this strategy for 41 days with a 250$ account and right now I have 2700$.
Bollingerbandstrategy

K's Reversal Indicator IK's reversal indicator I is a special combination between Bollinger bands and the MACD oscillator. It is a contrarian indicator that depends on the following conditions:
• A buy signal is generated whenever the current market price is below the 100-period lower Bollinger band while simultaneously, the MACD value must be above its signal line. At the same time, the previous MACD value must be below its previous signal line.
• A sell (short) signal is generated whenever the current market price is above the 100-period upper Bollinger band while simultaneously, the MACD value must be below its signal line. At the same time, the previous MACD value must be above its previous signal line.
The way to use K's reversal indicator is to combine it with your already long/short bias in a sideways/range market in order to maximize the probability of success.
Limitations of the indicator include the following:
• There are no clear exit rules that work well on average across the markets. Even though K’s reversal indicator gives contrarian signals, it does not show when to exit the positions.
• As with other indicators, it underperforms on some markets and is not to be used everywhere.
• False signals tend to occur during trending markets but there is no proven way to detect a false signal.

MadriEsta estrategia fue creada por mi, basándose en el indicador bollinger bands+rsi y una ema , forexstrategiesresources me lo pasó a codigo y despues fue publicado en ChartArt y en la pagina web de forexstrategiesresources.
Ahora este script lo he modificado para optimizarlo para BTC /USDT en la temporalidad de 1 hora, os invito a ir cambiando temporalidades y valores para conseguir la mayor rentabilidad y, al igual que yo lo publico en codigo abierto os invito a que pongáis vuestros ajustes en los comentarios.
Los ajustes que se pueden cambiar para buscar mayor rentabilidad son en primer lugar "lo que se puede cambiar desde el mismo grafico" los valores "A" y "B".
Además, en el codigo el valor "RSIoverSold" y el "RSIoverBought" por mi experencia con menos de 30 no suele ir bien y con mas de 70 tampoco, el rango adecuado es de 29 a 49, incluidos.
Yo no he trasteado mucho pero también os invito a cambiar la fuente de entrada de "close" a "high", "open", "low"...
Recomiendo para la configuración ACTUAL mismo símbolo, mismos valores operar las señales Short cuando el precio este por debajo de la EMA de 900 y operar las Long cuando este por encima.
En otros símbolos la cosa cambia, hay que adaptarlo a cada cosa.

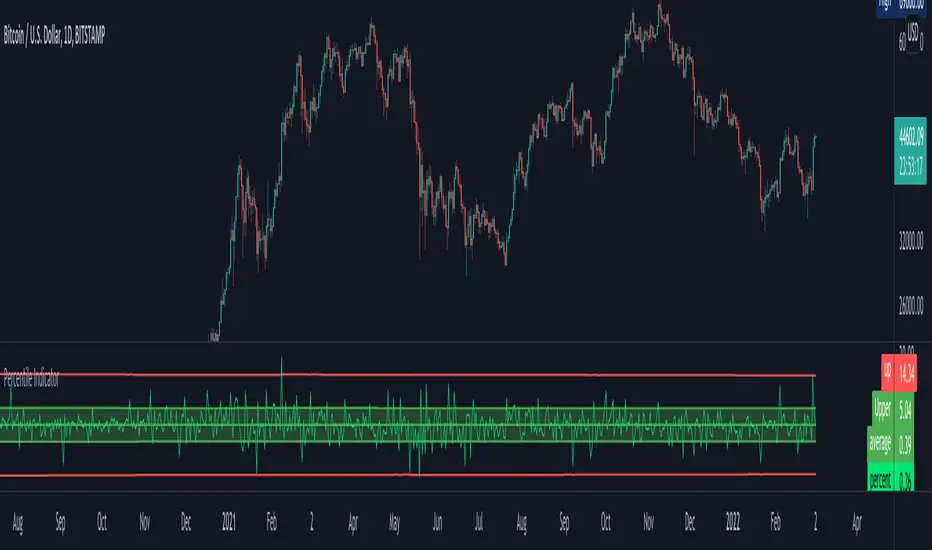
Percentile Major Move Indicator This indicator is a powerful tool for understanding how big of a move a product, crypto, or currency has recently had.
Anything inside of the green bars is a standard move with a 68% chance of happening based on your chart timeframe.
Any move that touches the red lines to the upside or downside has a 2%+ chance of happening in either direction.
This is a powerful indicator but just one point of data and should be used as such.
Trend Following with Bollinger BandsThis is a trend following system which uses the Bollinger Bands instead of the Donchian Channels.
Long position:
* Price closes above the middle line.
* The fast EMA (in this case the 40) crosses over or is above the slow one (in this case the 120)
Short position:
* Price closes below the middle line.
* The fast EMA crosses under or is below the slow one.
Stoploss:
* 4 ATRs away from the price.

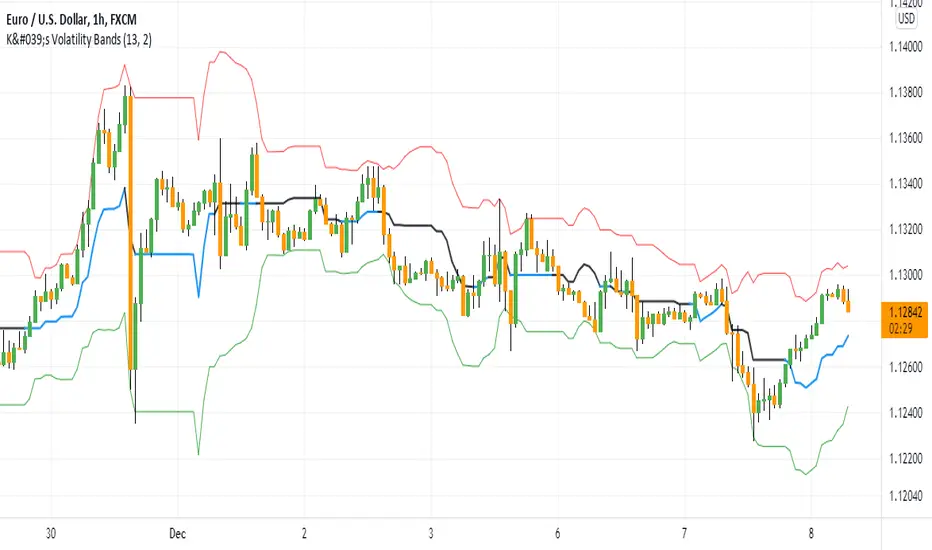
K's Volatility BandsVolatility bands come in all shapes and forms contrary to what is believed. Bollinger bands remain the principal indicator in the volatility bands family. K's Volatility bands is an attempt at optimizing the original bands. Below is the method of calculation:
* We must first start by calculating a rolling measure based on the average between the highest high and the lowest low in the last specified lookback window. This will give us a type of moving average that tracks the market price. The specificity here is that when the market does not make higher highs nor lower lows, the line will be flat. A flat line can also be thought of as a magnet of the price as the ranging property could hint to a further sideways movement.
* The K’s volatility bands assume the worst with volatility and thus will take the maximum volatility for a given lookback period. Unlike the Bollinger bands which will take the latest volatility calculation every single step of time, K’s volatility bands will suppose that we must be protected by the maximum of volatility for that period which will give us from time to time stable support and resistance levels.
Therefore, the difference between the Bollinger bands and K's volatility bands are as follows:
* Bollinger Bands' formula calculates a simple moving average on the closing prices while K's volatility bands' formula calculates the average of the highest highs and the lowest lows.
* Bollinger Bands' formula calculates a simple standard deviation on the closing prices while K's volatility bands' formula calculates the highest standard deviation for the lookback period.
Applying the bands is similar to applying any other volatility bands. We can list the typical strategies below:
* The range play strategy : This is the usual reversal strategy where we buy whenever the price hits the lower band and sell short whenever it hits the upper band.
* The band re-entry strategy : This strategy awaits the confirmation that the price has recognized the band and has shaped a reaction around it and has reintegrated the whole envelope. It may be slightly lagging in nature but it may filter out bad trades.
* Following the trend strategy : This is a controversial strategy that is the opposite of the first one. It assumes that whenever the upper band is surpassed, a buy signal is generated and whenever the lower band is broken, a sell signal is generated.
* Combination with other indicators : The bands can be combined with other technical indicators such as the RSI in order to have more confirmation. This is however no guarantee that the signals will improve in quality.
* Specific strategy on K’s volatility bands : This one is similar to the first range play strategy but it adds the extra filter where the trade has a higher conviction if the median line is flat. The reason for this is that a flat line means that no higher highs nor lower lows have been made and therefore, we may be in a sideways market which is a fertile ground for mean-reversion strategies.
Bollinger Band Breakout Positional Strategy- BN -15M This strategy consists of following criteria:
Buy:
1. Candle should have RSI is above 60 and Close above Bollinger band upper limit
2. Exit When candle is closed below 20MA
Sell:
1. Candle should have RSI is above 40 and Close below Bollinger band lower limit
2. Exit When candle is closed above 20MA
Checkout results.

Bollinger Bands Fibonacci Ratios StrategyHello, everyone!
We have just released an innovative strategy for TradingView. It allows you to identify price pivot points and volatility.
This strategy is:
User-friendly
Configurable
Equipped with Bollinger Bands and smoothed ATR to measure volatility
Features
Thanks to the BB Fibo strategy, you can:
Trade stocks and commodities.
Identify price pivot points.
Choose any band for trading Long or Short positions.
Swap upper and lower bands applying Use Reverse Buy/Sell parameters.
Note! The upper bands are for the Long position. The lower bands are for the Short positions.
Parameters
We have equipped our strategy with more than 14 additional parameters. So, you can configure the EA according to your needs!
Inputs:
Length
Source: Open, High, Low, Close, HL2, HLC3, OHLC4
Offset
Fibonacci Ratio 1 — a Fibonacci factor for the 1st upper and lower indicator lines calculating.
Fibonacci Ratio 2 — a Fibonacci factor for the 2nd upper and lower indicator lines calculating.
Fibonacci Ratio 3 — a Fibonacci factor for the 3d upper and lower indicator lines calculating.
Use Reverse Buy — the strategy will use lower Bollinger bands instead of upper ones.
Fibonacci Buy — band selection for opening Long positions conditions.
Use Reverse Sell — the strategy will use upper Bollinger bands instead of lower ones.
Fibonacci Sell — band selection for opening Short positions conditions.
Style:
Basis — baseline color and style settings.
Upper 3 — the 3d upper line color and style.
Upper 2 — the 2nd upper line color and style.
Upper 1 — the 1st upper line color and style.
Lower 1 — the 1st lower line color and style.
Lower 2 — the 2nd lower line color and style.
Lower 3 — the 3d upper line color and style.
Background — the background color within the 3d upper and 3d lower indicator band.
Precision — the number of decimals for BB Fibo values.
Note! Try BB Fibo on your demo account first before going live.

Sideways Strategy DMI + Bollinger Bands (by Coinrule)Markets don’t always trade in a clear direction. At a closer look, most of the time, they move sideways. Relying on trend-following strategies all the time can thus lead to repeated false signals in such conditions.
However, before you can safely trade sideways, you have to identify the most suitable market conditions.
The main features of such strategies are:
Short-term trades, with quick entries and quick exits
Slightly contrarian and mean-reversionary
Require some indicator that tells you it’s a sideways market
This Sideways DMI + Bollinger Bands strategy incorporates such features to bring you a profitable alternative when the regular trend-following systems stop working.
ENTRY
1. The trading system requires confirmation for a sideways market from the Directional Movement Index (DMI) before you can start opening any trades. For this purpose, the strategy uses the absolute difference between positive and negative DMI, which must be lower than 20.
2. To pick the right moment to buy, the strategy looks at the Bollinger Bands (BB). It enters the trade when the price crosses over the lower BB.
EXIT
The strategy then exits when the move has been exhausted. Generally, in sideways markets, the price should revert lower. The position is closed when the price crosses back down below the upper BB.
The best time frame for this strategy based on our backtest is the 1-hr. Shorter timeframes can also work well on certain coins that are more volatile and trade sideways more often. However, as expected, these exhibit larger volatility in their returns. In general, this approach suits medium timeframes. A trading fee of 0.1% is taken into account. The fee is aligned to the base fee applied on Binance, which is the largest cryptocurrency exchange.
You can execute this strategy on your favourite exchange at coinrule.com.

ViVen-Multi Time Frame Bollinger Band StrategyThis indicator created to identify the strong Support and Resistance levels based on the Bollinger Bands. When two different time frame Bollinger Bands are travelling together then its a strong Support or Resistance Levels.
I have added 5 Min, 15 Min, 30 Min, 1 Hr and 1 Day time frame Bollinger Bands in one Chart. You can select and combine whichever the TF you want.
Default values considered - Period - 20 and Std.Dev is 2
You can on/off the indicator based on the requirement.
Trade plan:
BUY - When price comes near to the Bottom Bollinger Band level (look for candle confirmation is plus). If multiple Bollinger bands travels together then is Strong Support. (Exit if Price Breaks down the BB)
SELL - When price reaches the Upper Bollinger Band level (look for candle confirmation is plus). If multiple Bollinger bands travels together then is Strong Support. (Exit if Price Breaks Up the BB)
Middle Line - is the 20 SMA line
When the Gap between Upper and Lower Band is narrow then we can expect a trending movement soon.

Bollinger Bands And Aroon Scalping (by Coinrule)Many technical indicators can be profitable in certain market conditions while failing in others. No indicator is perfect alone.
All the best trading strategies involve multiple indicators and leverage the benefit of each of them. The following is an optimised strategy based on Bollinger Bands and the Aroon indicator.
The Bollinger Bands are among the most famous and widely used indicators. They can suggest when an asset is oversold or overbought in the short term, thus provide the best time for buying and selling it.
A strategy buying dips can work well during times of uptrend. Downtrends will result in a drawdown for the P&L of the strategy. The suggested approach minimises the drawdowns, ensuring that the system trades only when it's more likely to close the trade in profit.
The Setup
ENTRY
The price crosses below the basis line of the Bollinger Band indicator
The Aroon Indicator is above 90
EXIT
The price crosses below the upper Bollinger Band
The Aroon Indicator drops below 70
The Aroon Indicator plays a key role in this strategy. It acts as a confirmation that the asset is currently in an uptrend. On the other hand, it acts as a stop if market conditions deteriorate. The strategy uses an Aroon Indicator set to 288 periods to provide a longer-term view on market conditions, not being heavily dependent on short-term volatility.
The best time frame for this strategy based on our backtest is the 4-hr . The 1-hr can work well with three times more trades, on average. As trades increase, the profitability decreases. Yet again, this is the confirmation that trading more does not mean gaining more.
To make the results more realistic, the strategy assumes each order to trade 30% of the available capital. A trading fee of 0.1% is taken into account. The fee is aligned to the base fee applied on Binance, which is the largest cryptocurrency exchange.

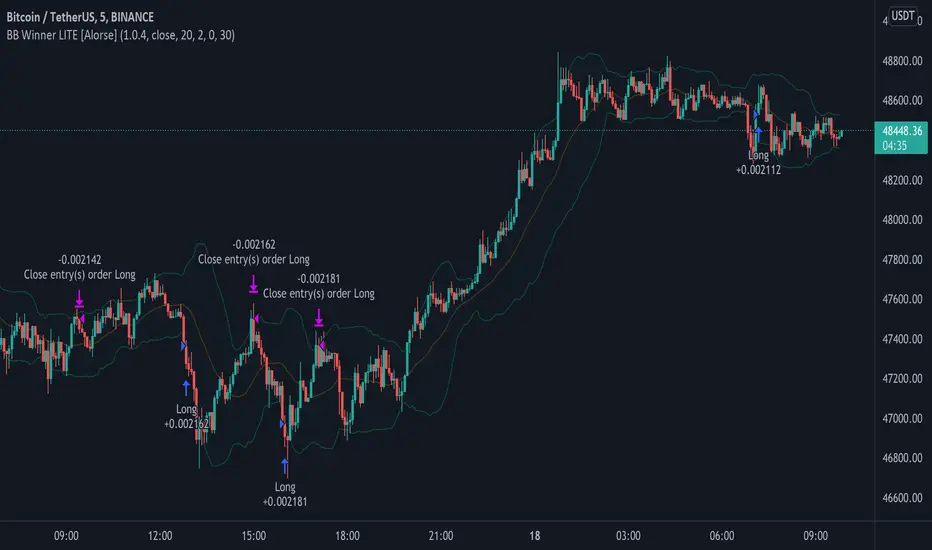
Bollinger Bands Strategy [Alorse]This is a highly effective strategy that is based on going against the micro trend when the price exceeds the Bollinger bands by X percentage.
The percentage set by default to 30%, you can change it from the indicator settings.
You also have the option of enabling or disabling Short entries.
OGT Bollinger Bandwidth IndicatorWhat is the OGT Bollinger Bandwidth Indicator?
The Bollinger Bands indicator is one of the most popular technical trading indicators. One of the applications of the Bollinger Bands indicator is when an instrument is in a state of low/high volatility. The OGT Bollinger Bandwidth Indicator measures the percentage distance between the upper and lower Bollinger bands to visually display periods of low/high volatility.
The difference between this indicator and other bandwidth indicators, is that the user can define a percentage level where if the indicator reading is above that level the instrument is considered to be in high volatility. If the indicator reading is below this level, it's considered to be low volatility. This is visually displayed on the indicator (default - Red = low volatility / Green = high volatility).
How to select the right percentage level?
This indicator has a built in black line which shows the lowest indicator reading for the past 100 bars. This gives you insight on where you should be placing your percentage level for that instrument and time frame. You will need to adjust the percentage level when you select a new time frame as the Bollinger Band levels will be different.
How this Indicator can help you trade profitably?
As the saying goes - periods of low volatility is followed by period of high volatility. The OGT Bollinger Bandwidth Indicator allows instantly see and watch for periods of low volatility and capitalise when the tide turns. This is not a direction indicator but gives you an early warning sign that a big move is coming. Using other technical indicators such as moving averages / support and resistance can help you with the direction.

Compare Crypto Bollinger Bands//This is not financial advice, I am not a financial advisor.
//What are volatility tokens?
//Volatility tokens are ERC-20 tokens that aim to track the implied volatility of crypto markets.
//Volatility tokens get their exposure to an asset’s implied volatility using FTX MOVE contracts.
//There are currently two volatility tokens: BVOL and IBVOL.
//BVOL targets tracking the daily returns of being 1x long the implied volatility of BTC
//IBVOL targets tracking the daily returns of being 1x short the implied volatility of BTC.
/////////////////////////////////////////////////////////////////
CAN USE ON ANY CRYPTO CHART AS BINANCE:BTCUSD is still the most dominant crypto, positive volatility for BTC is positive for all.
/////////////////////////////////////////////////////////////////
//The Code.
//The blue line (ChartLine) is the current chart plotted on in Bollinger
//The red line (BVOLLine) plots the implied volatility of BTC
//The green line (IBVOLLine) plot the inverse implied volatility of BTC
//The orange line (TOTALLine) plots how well the crypto market is performing on the Bolling scale. The higher the number the better.
//There are 2 horizontal lines, 0.40 at the bottom & 0.60 at the top
/////////To Buy
//1. The blue line (ChartLine) must be higher than the green line (IBVOLLine)
//2. The green line (IBVOLLine) must be higher than the red line (BVOLLine)
//3. The red line (BVOLLine) must be less than 0.40 // This also acts as a trendsetter
//4. The orange line (TOTALLine) MUST be greater than the red line. This means that the crypto market is positive.
//5.IF THE BLUE LINE (ChartLine) IS GREATER THAN THE ORANGE LINE (TOTALLine) IT MEANS YOUR CRYPTO IS OUTPERFOMING THE MARKET {good for short term explosive bars}
//6. If the orange line (TOTALLine) is higher than your current chart, say BTCUSD. And BTC is going up to. It just means BTC is going up slowly. it's fine as long as they are moving in the same position.
//5. I use this on the 4hr, 1D, 1W timeframes
///////To Exit
//1.If the blue line (ChartLine) crosses under the green line (IBVOLLine) exit{ works best on 4hr,1D, 1W to avoid fakes}
//2.If the red line crosses over the green line when long. {close positions, or watch positions} It means negative volatility is wining

Newton theory (Bollinger Band Breakout)Initial capital 1000 USD
Order size 10%
Commission 0.3% with slippage
Timeframe 4h
This is Simple Bollinger Band Trend find out strategy.
I'm using the usual trailing offset as an exit for this strategy.
using 1x leverage to go long short within 3years backtest result more then 200% for all usd pair.
in next version i will try to find out more optimize sma,std,sl,tp parameter by using freqtrade hyperparameter optimization.
Happy Trading :)

Khair - Day Trade StrategyBollinger band breakout with non-standard deviation along with profit targets
Best used when applied for intraday trading. Users can customize length and deviation and test what works best for them.
Trade both long and shorts, the user also has the option to limit to long-only or both.
This strategy only works intraday interval, so it means when you try to apply it to day/week/month it won't apply.

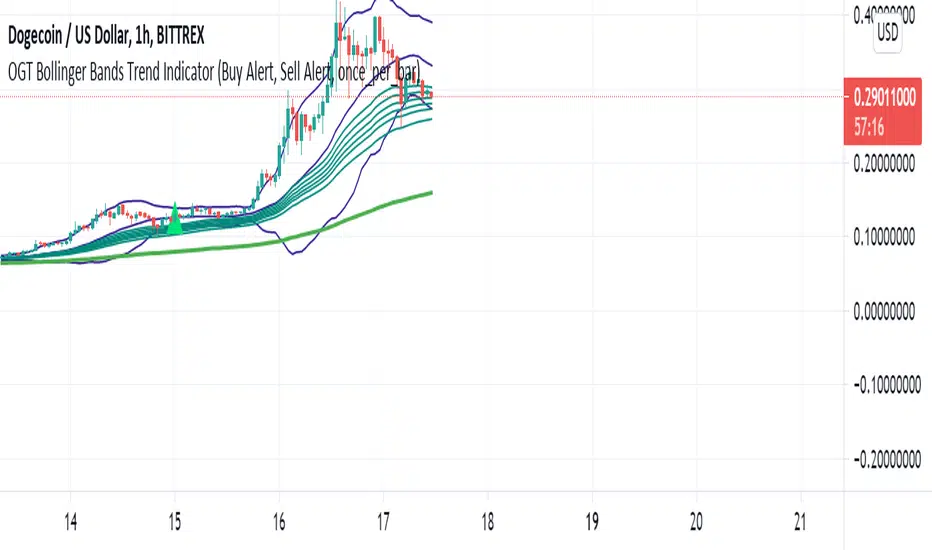
OGT Bollinger Bands Trend IndicatorWhat Is The OGT Bollinger Bands Trend Indicator?
This indicator is a pullback trend trading indicator which uses the following indicators:
- 200 EMA - Long Term Trend Direction
- 30, 35, 40, 45, 50, 60 EMAs - Shorter Term Trend Direction
- Bollinger Bands - Pullback / Entry Signal
How Are Signals Generated?
Buy
- Price above the 200 EMA
- Price touches lower BB with shorter term EMAs all aligned (not crossed)
- Indicator waits for price to close above midpoint BB with shorter term EMAs all still aligned (not crossed)
Sell
- Price below the 200 EMA
- Price touches upper BB with shorter term EMAs all aligned (not crossed)
- Indicator waits for price to close above midpoint BB with shorter term EMAs all still aligned (not crossed)
Alerts function built in, input settings customisable to show/not show indicators and change colours.
Bollinger bubble | Forex editionBollinger bubble is an edition for forex market. Work better en JPY pairs.
We buy when a candle open & close outside the lower bollingers band and we target the last highest point on the last 10 candles.
And we sell when a candle open & close outside the higher bollingers band we the target the last lowest point on the last 10 candles.

Bollinger bubble | Stock EditionBollinger bubble is an edition for market like CAC40, DJ30, ..
The market are uptrend with the inflation, this edition only buy (you have less risk then sell)
We buy when a candle open & close outside the lower bollingers band and we target the last highest point on the last 10 candles.

Bollinger Band with RSI
Using combination bollinger band and RSI indicator as guide to predict price volatility and the best entry point. The strategy logic is pretty straightforward where we're interested with close price that touches the lower bollinger band ; there are only two scenarios that will happened after the price reaches the lower band; the price might rebound from the lower bollinger band or drop lower and continue downtrend. To confirm the price movement, we use a second indicator which is the RSI to further investigate the price trend. For example, if the price reaches the lower bollinger band but the RSI value is not in the oversold region, we can conclude that the price will go lower and continue downtrend. If the RSI value is in the oversold region, we can use this price area as our entry point.
Stop loss is necessary to avoid losing too much capital if the RSI value lingers too long in the oversold region.
Best take profit area is when the price rebound above the middle bollinger band area/upper bollinger band or when the RSI reaches overbought region; whichever comes first.
Long entry:
RSI < 30 & close price < lower bollinger band
Exit entry:
RSI > 70
Default stop loss: -25%

Beacon - Anthony Crudele's IndicatorBeacon uses the current volatility of the market based on your trading time frame to determine support and resistance levels, whether a trend is intact or ready to revert back in the range. One of the most difficult things I went through as a trader was determining whether we are in a trend day or if we are in grind up or grind down mode. I created Beacon to give me a simple look at the market to determine what type of environment we are in. I use Bollinger Bands (3 standard deviation) to determine the volatility cycle. Once the BB make peaks I took my Fibonacci Retracement tool and did a retracement from the peak high of the BB to the peak low. I use 70%, 50% and 30% for my support and resistance levels. I use those levels because I tested pretty much every percent level and those percentages averaged the highest performance on all tick charts and time charts. You can use Beacon on whatever time frame or tick chart you are trading on and it will determine that specific volatility cycle.

Bollinger Bands Pro : Hawk-Eye (by ImanPJN)Bollinger Bands Pro: Hawk Eye / is a professional version of the Bollinger Band Indicator that uses two bands instead of one. This is the second band I call the upper and lower middle band.
Sometimes you see that the candles are rejected from parts of the band and you do not know the real reason.
The real reason is the middle band, which is a secret line that we show you in Hawk eye and give you a professional and complete view of the trend and momentum of the trend.
This important line gives you the dynamic support and resistance points that were previously hidden from you.
The line also allows traders to pinpoint their entry and exit points, as well as notice that trend strengths or trend momentum are being lost.
Now we want to discuss the trading methods and strategies of this indicator, three main strategies that should be considered, the first is following the trend and the second is breaking the line And third is the Bollinger Bands divergences with the "BB %B" oscillator.
1 - Following the Trend :
You can follow the trend and when a good downtrend or uptrend is formed, enter the trade every time candles hits the middle band and bounces back and you can hold the position it until the middle band or baseline is broken .
2 - Breaking the Line :
When the middle band or baseline as our dynamic trend line is broken with a complete candlestick, we can close the trade or trade the reverse trend, but we recommend that you do not use trend reversal signals if you do not have enough skills.
3 - Bollinger Bands divergences :
We can also use the Bollinger Bands and the BB Percentage Index to find bullish and bullish divergence or overbought and oversold points. But it requires more mastery and research on both indicators
Coded by Iman Pajand in Partnership with @BITEXGroup

Sentinel Program - A Bollinger Band Strategy, with alertsThis script plots the Bollinger Bands and confirms entry and exits by using RSI values, Stoch, and ADX Curve. Works on any time-frame.
The scope of the script is to reduce the number of fake breakouts to prevent further declines when entering positions. Often times when using Bollinger bands, a close below the lower band presents a buying opportunity but there is further movent to the downside and vise versa when taking profits.
Entry Conditions
Prior candle low below lower band
RSI above 30
Stochastic crossover above 20
ADX curve greater than 25
Exit Conditions
Prior candle highw above upper band
RSI crosses below 70
Stochastic crossunder above 80
Each of the above values can be adjusted in the inputs menu to fine-tune your entry and exit positions.
Using COINBASE:ETHUSD we can see that the conditions have been met before plotting buy and sell signals.
I have added alerts to help identify possible entry and exits and from there I manually enter or exit / adjust stop-loss. For example, sometimes it will print a sell signal because stochastic crossed over but RSI is still rising so I will adjust a tighter stop-loss to capture further gain if they are there.
Test it out, adjust the settings to see if you can find better results, and let me know!
